---
title: "General Interactivity"
output:
rmarkdown::html_vignette:
self_contained: FALSE
vignette: >
%\VignetteIndexEntry{General Interactivity}
%\VignetteEngine{knitr::knitr}
%\VignetteEncoding{UTF-8}
---
```{r, include = FALSE}
knitr::opts_chunk$set(
collapse = TRUE,
comment = "#>"
)
```
## Overview
The lionfish package offers multiple different types of general
interactivity. The following operations can be performed with the
elements on the frame on the left.
- Feature selection
- Subset selection and highlighting
- Resetting to original subsets
- Updating currently displayed projection frames
- Changing the number of bins of histograms
- Animating the currently loaded tours
- Setting a threshold for blending projection axes with a low length out
- Saving and loading the state of the GUI
- Initiating new tours
Examples for all displays can be found below.
## Setup
```{r setup}
# Load required packages
library(tourr)
library(lionfish)
# Initialize python backend
if (check_venv()){
init_env(env_name = "r-lionfish", virtual_env = "virtual_env")
} else if (check_conda_env()){
init_env(env_name = "r-lionfish", virtual_env = "anaconda")
}
```
### Dataset - Flea data
```{r Load and prepare flea data}
data("flea")
data <- apply(flea[,1:6], 2, function(x) (x-mean(x))/sd(x))
clusters <- as.numeric(flea$species)
flea_subspecies <- unique(flea$species)
guided_tour_history <- save_history(data,
tour_path=guided_tour(holes()))
grand_tour_history_1d <- save_history(data,
tour_path=grand_tour(d=1))
half_range <- max(sqrt(rowSums(data^2)))
feature_names <- colnames(data)
obj1 <- list(type="2d_tour", obj=guided_tour_history)
obj2 <- list(type="1d_tour", obj=grand_tour_history_1d)
obj3 <- list(type="scatter", obj=c("tars1", "tars2"))
obj4 <- list(type="hist", obj="head")
if (check_venv()){
init_env(env_name = "r-lionfish", virtual_env = "virtual_env")
} else if (check_conda_env()){
init_env(env_name = "r-lionfish", virtual_env = "anaconda")
}
if (interactive()){
interactive_tour(data=data,
plot_objects=list(obj1, obj2, obj3, obj4),
feature_names=feature_names,
half_range=half_range,
n_plot_cols=2,
preselection=clusters,
preselection_names=flea_subspecies,
n_subsets=5,
display_size=4.5)
}
```
## Currently supported general interactivity
### Feature selection
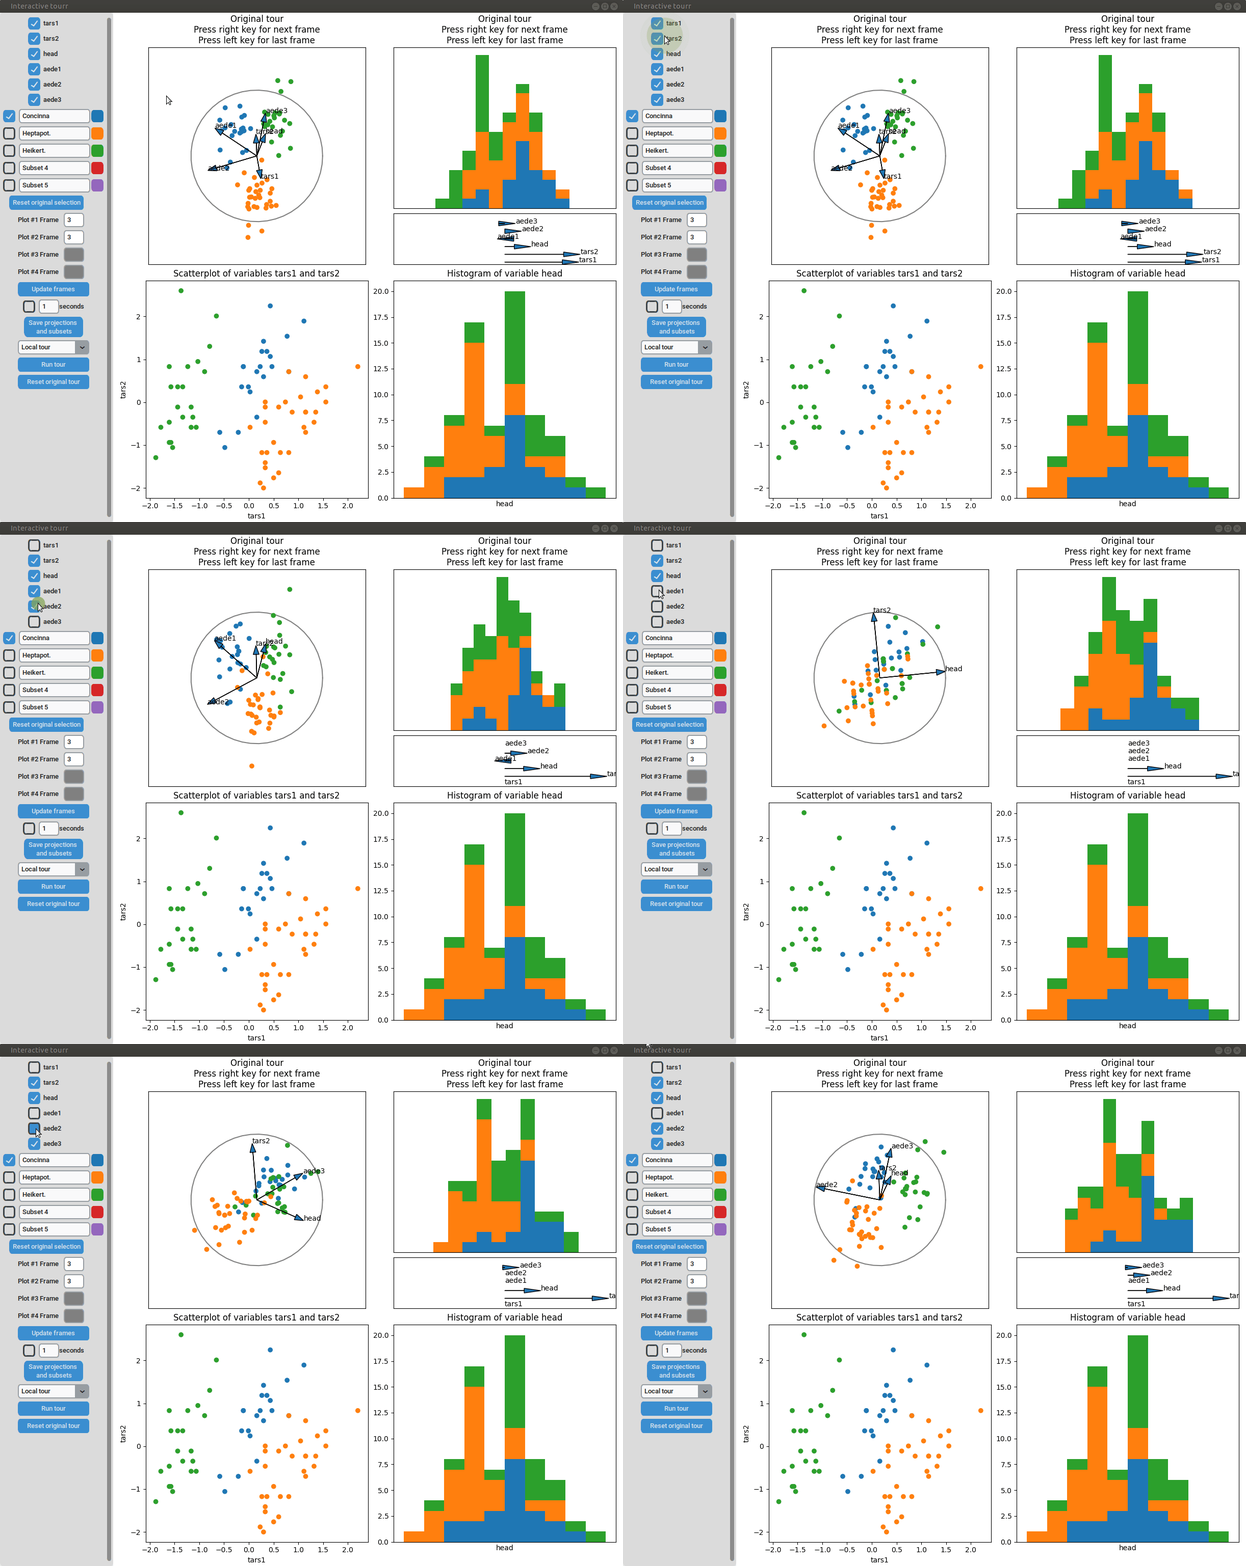
A list of all features can be found on the top left. Each feature has a
checkbox next to it. The features are selected or deselected by checking
or unchecking the respective checkboxes.
{width=100%}
### Subset selection and highlighting
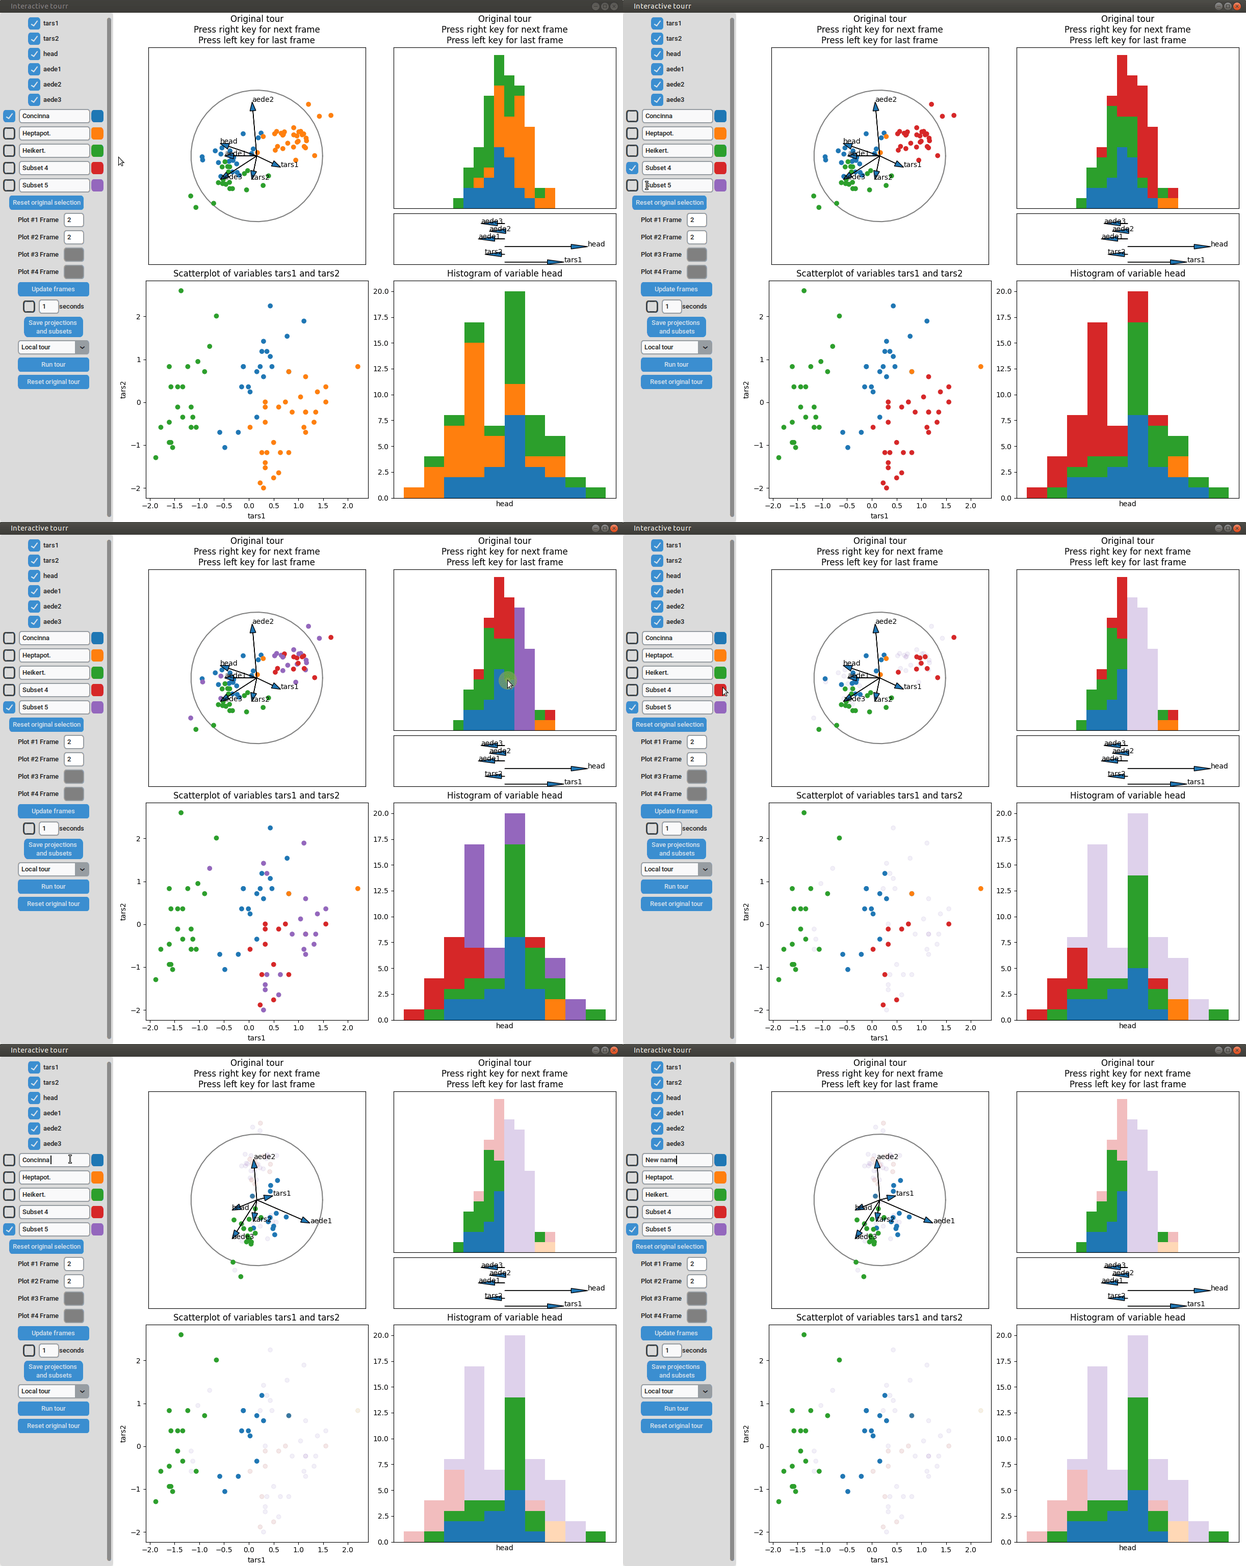
A list of all subsets can be found below the features. Each subset has a
checkbox next to it. The subsets are selected checking respective
checkboxes next to them. When a subset is active, all datapoints that
are selected with one of the interactive plots will be moved to that
subset. The colored patches next to the subsets indicate the color of
the datapoints within the respective subset. The transparency of the
datapoints of the subsets can be changed by clicking the colored patches
next to the subset names. The names of the subsets can be changed by
writing in the textboxes.
{width=100%}
### Resetting to original subsets
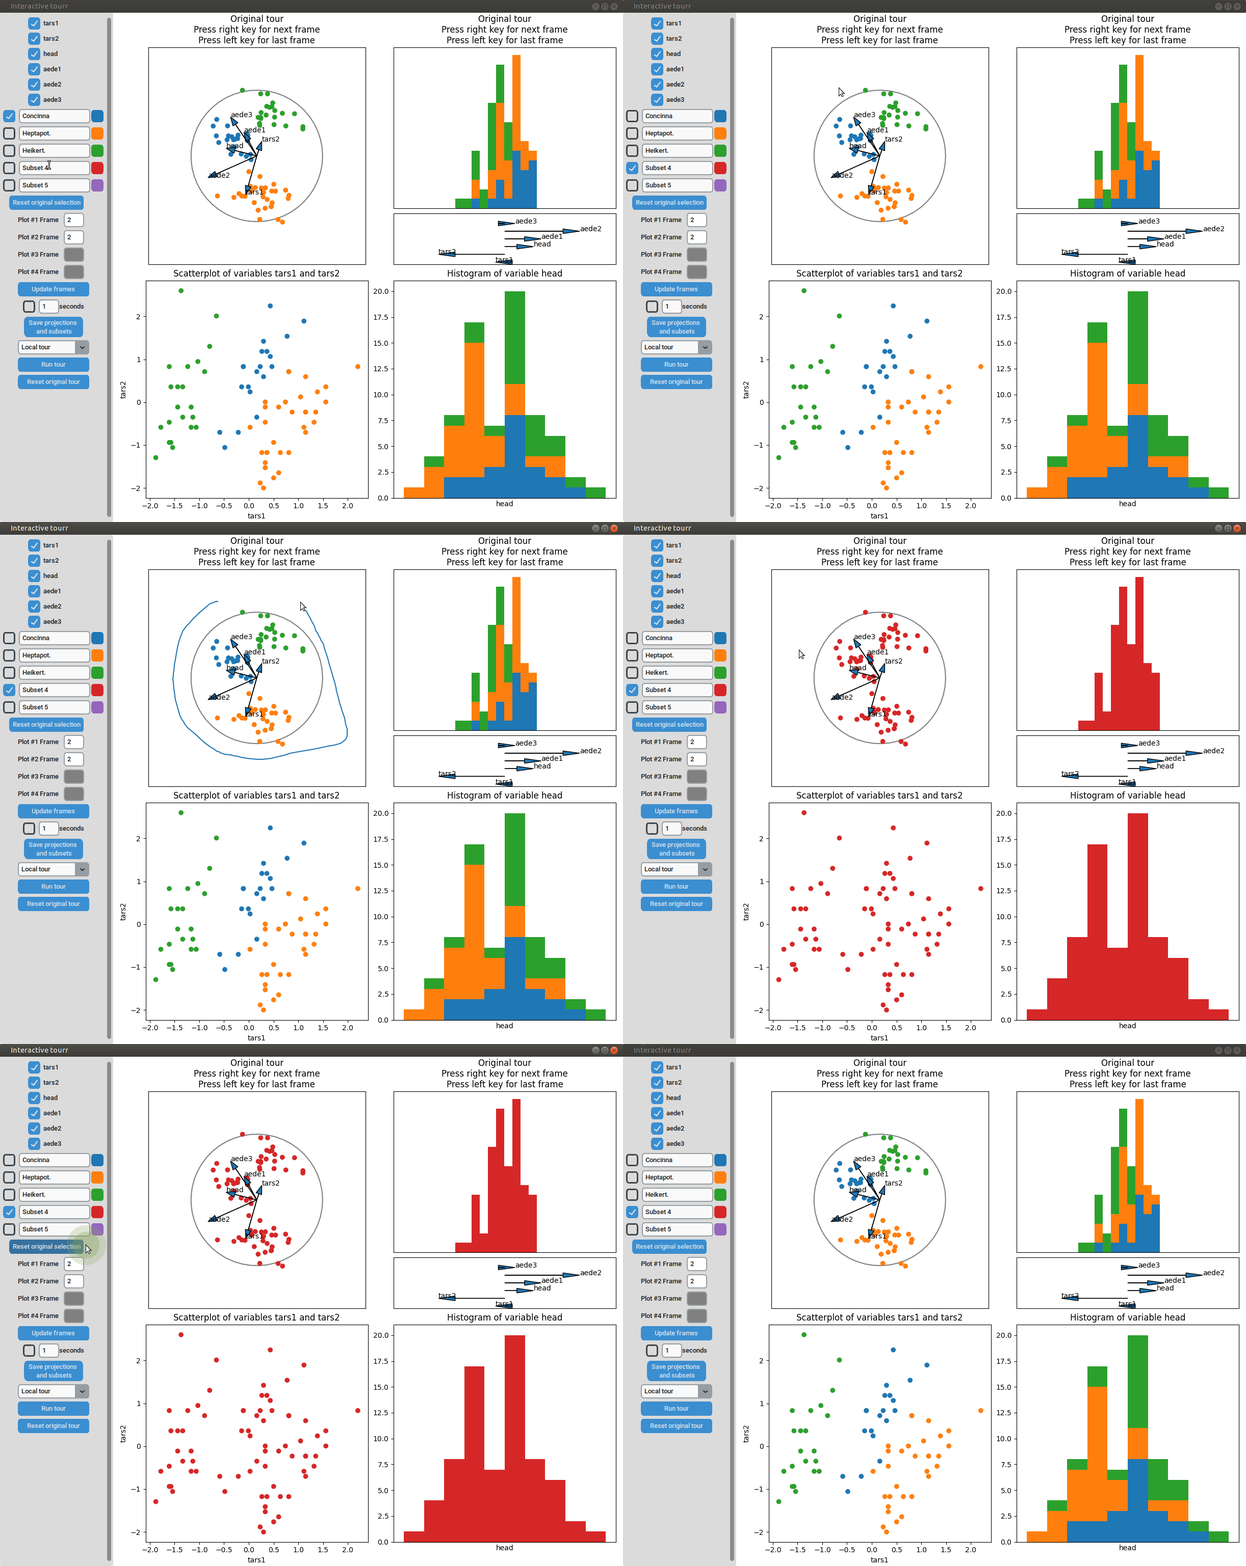
The current subset selection can easily be reset by clicking the "Reset
original selection" button.
{width=100%}
### Updating currently displayed projection frames
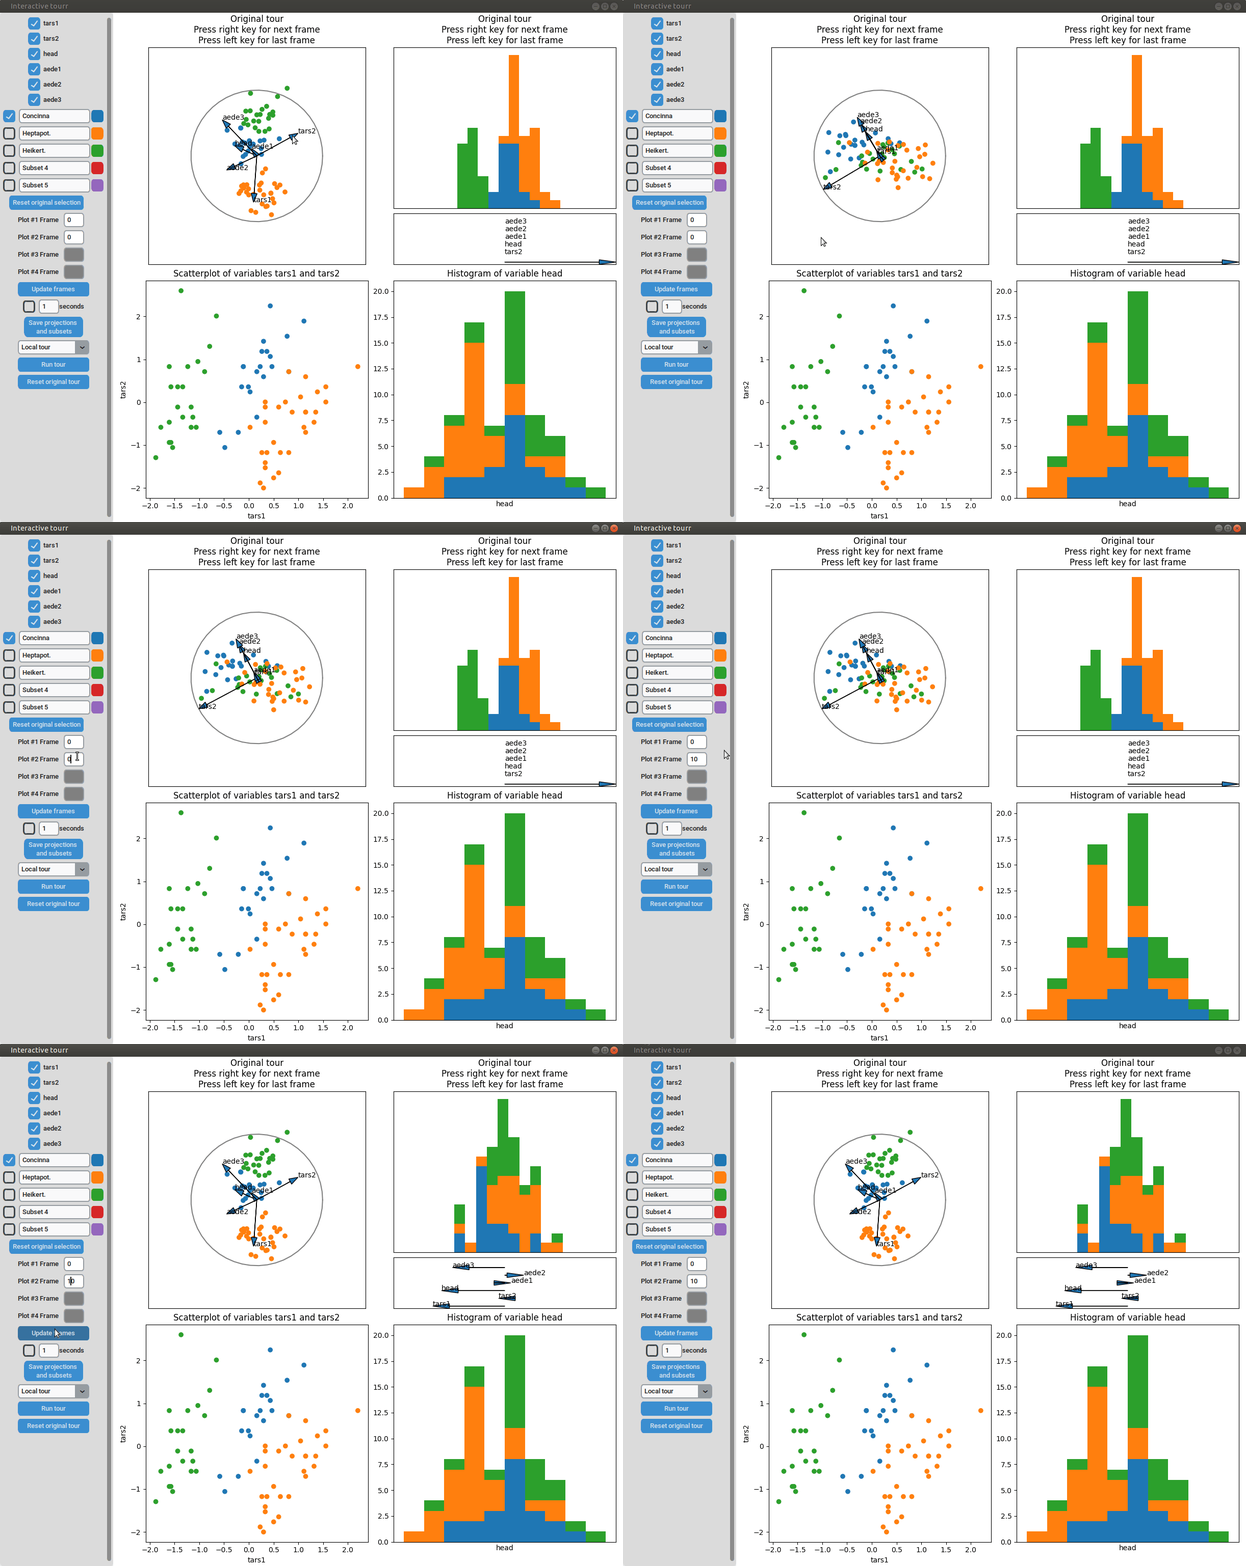
One can jump between frames of tours by typing the desired frame one wants to
jump to into the corresponding textboxes and clicking the "Update frames"
button. Updating the frames can also be useful if some of the plots haven't
updated properly or one wants to reset the shown projections of a frame after
manipulation of the projection axes.
{width=100%}
### Changing the number of bins of histograms
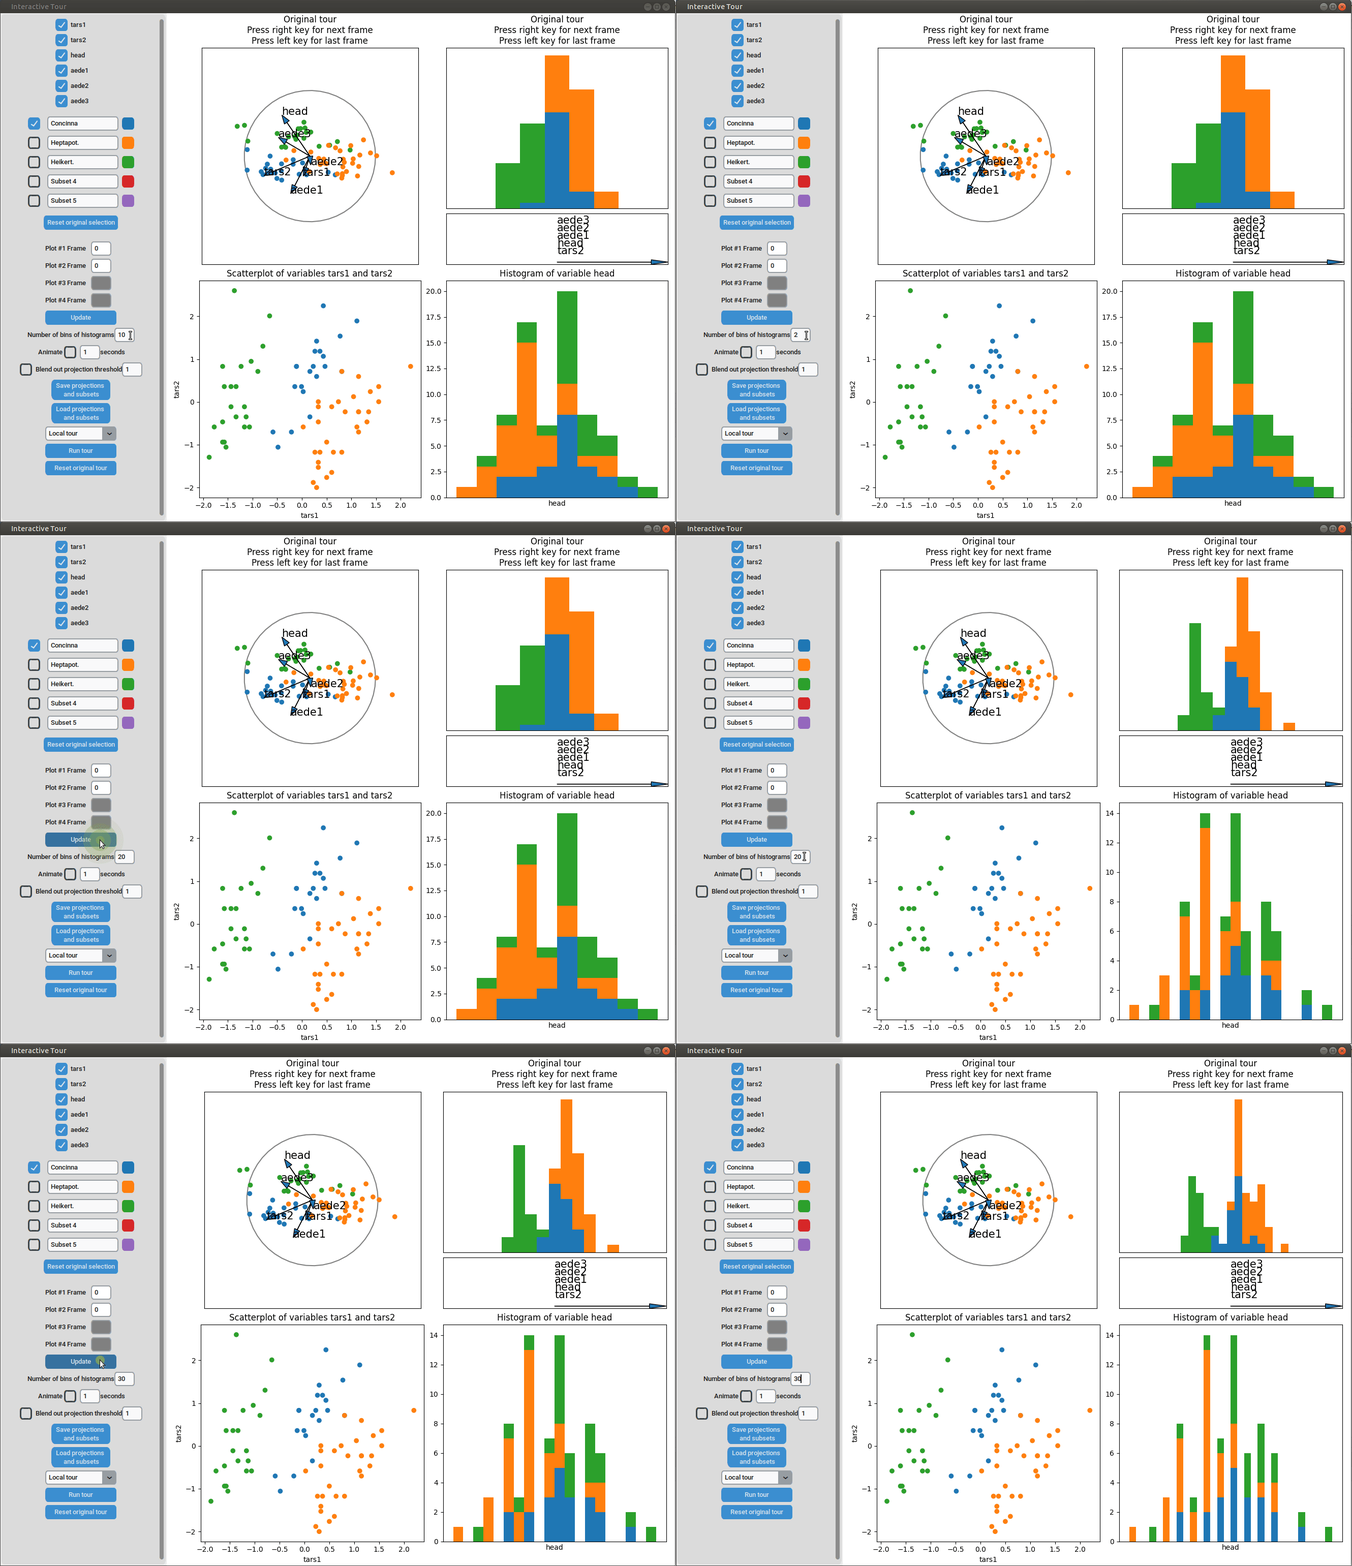
The number of bins of histograms can be changed by typing the desired number of
bins in the corresponding textbox. A larger number of bins results in a higher
resolution, but it will increase the time it takes to update histograms due the
increased computational load.
{width=100%}
### Animating the currently loaded tours
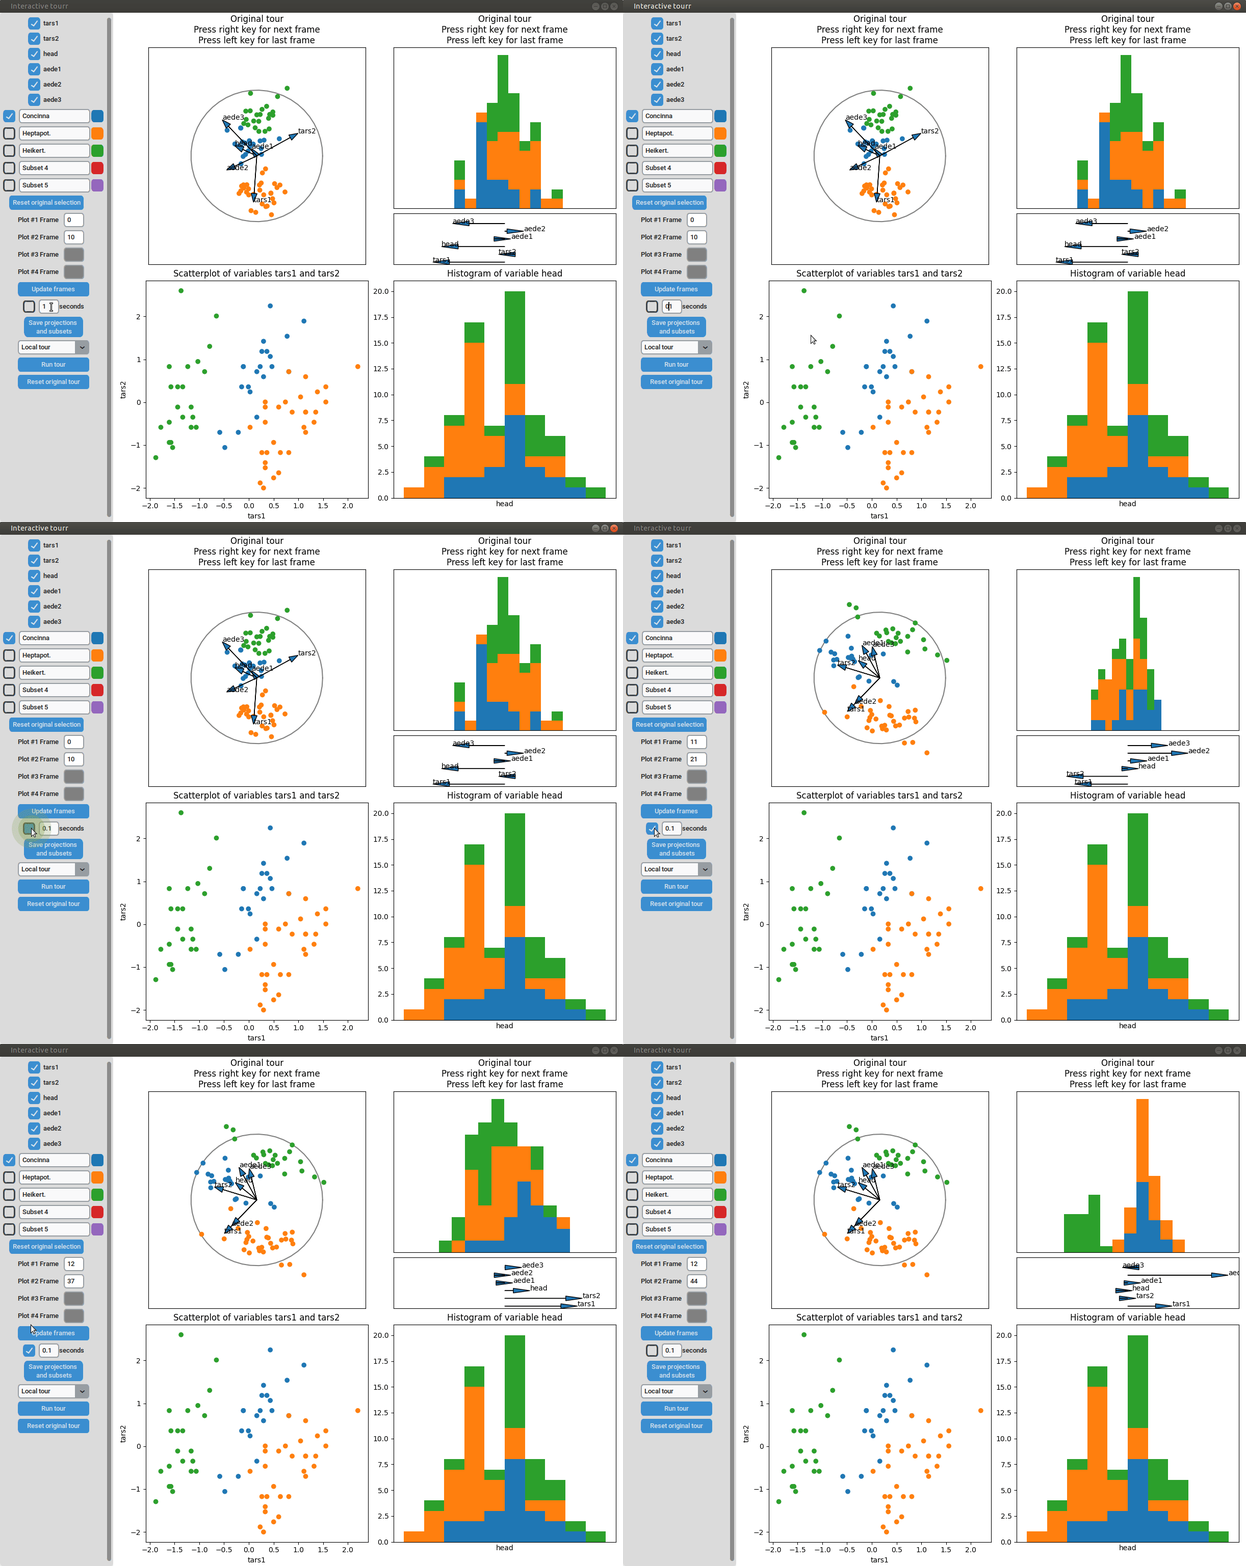
The currently loaded tours can be animated by checking the checkbox
below the "Update frames" button. The interval in which the next frames
will be loaded can be changed in the textbox next to the checkbox.
{width=100%}
### Setting a threshold for blending projection axes with a low length out
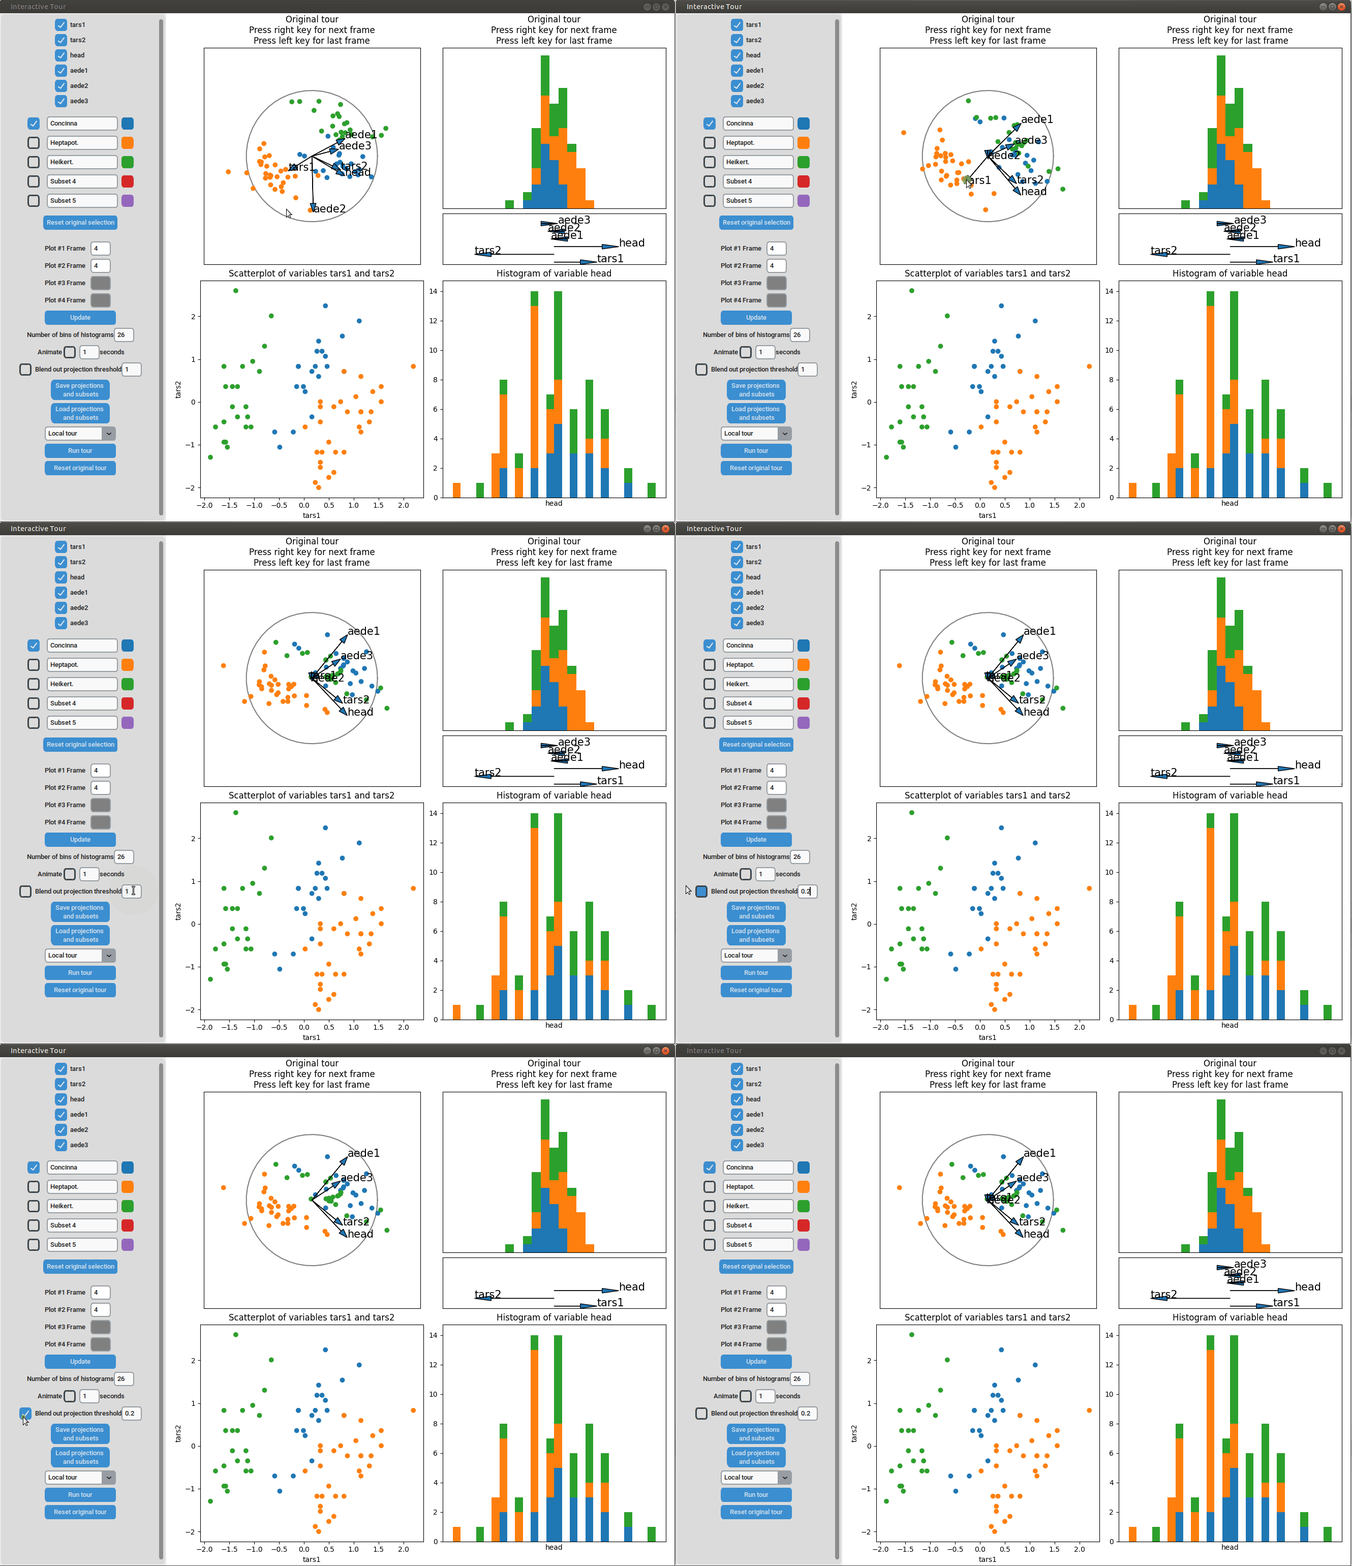
If there are many projection axes displayed it can clutter the plot. To combat
this the option to blend out projection axes of low length has been implemented.
Therefore, a projection threshold (a float between 0 and 1) can be set and by
checking the checkbox, projection axes that are shorter than the threshold are
blended out.
{width=100%}
### Saving and loading the state of the GUI
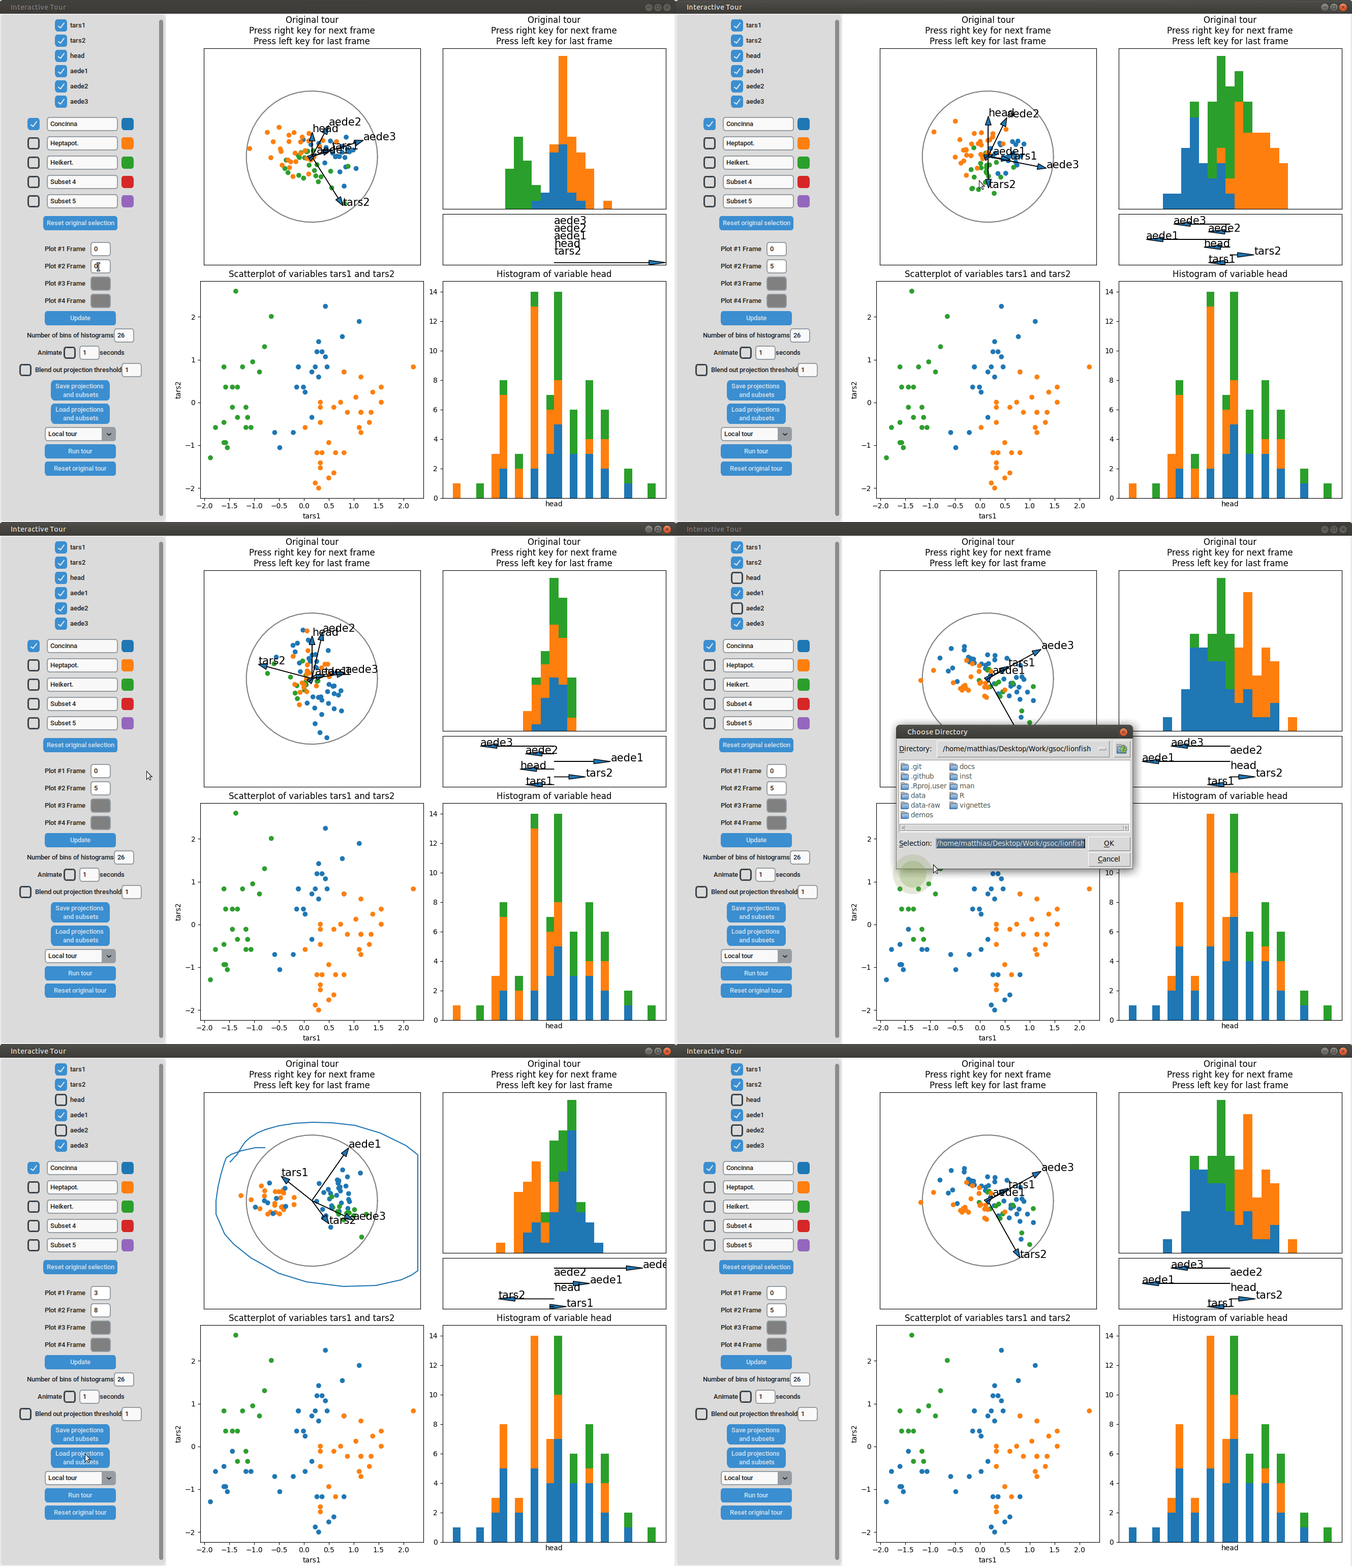
The current state of the GUI can be saved by clicking the "Save projections and
subsets" button. This will produce a file browser with which one can choose the
directory for the files to be saved in. The saved files are
- a .png file containing the currently displayed graphics
- .csv files that capture the feature and subset selection as well as
projections of the tours displayed at the time of the snapshot
- two .pkl files that contain state features of the GUI, allowing for complete
recovery of the saved state
Alternatively the function load_interactive_tour() can be used to load a save
directly.
{width=100%}
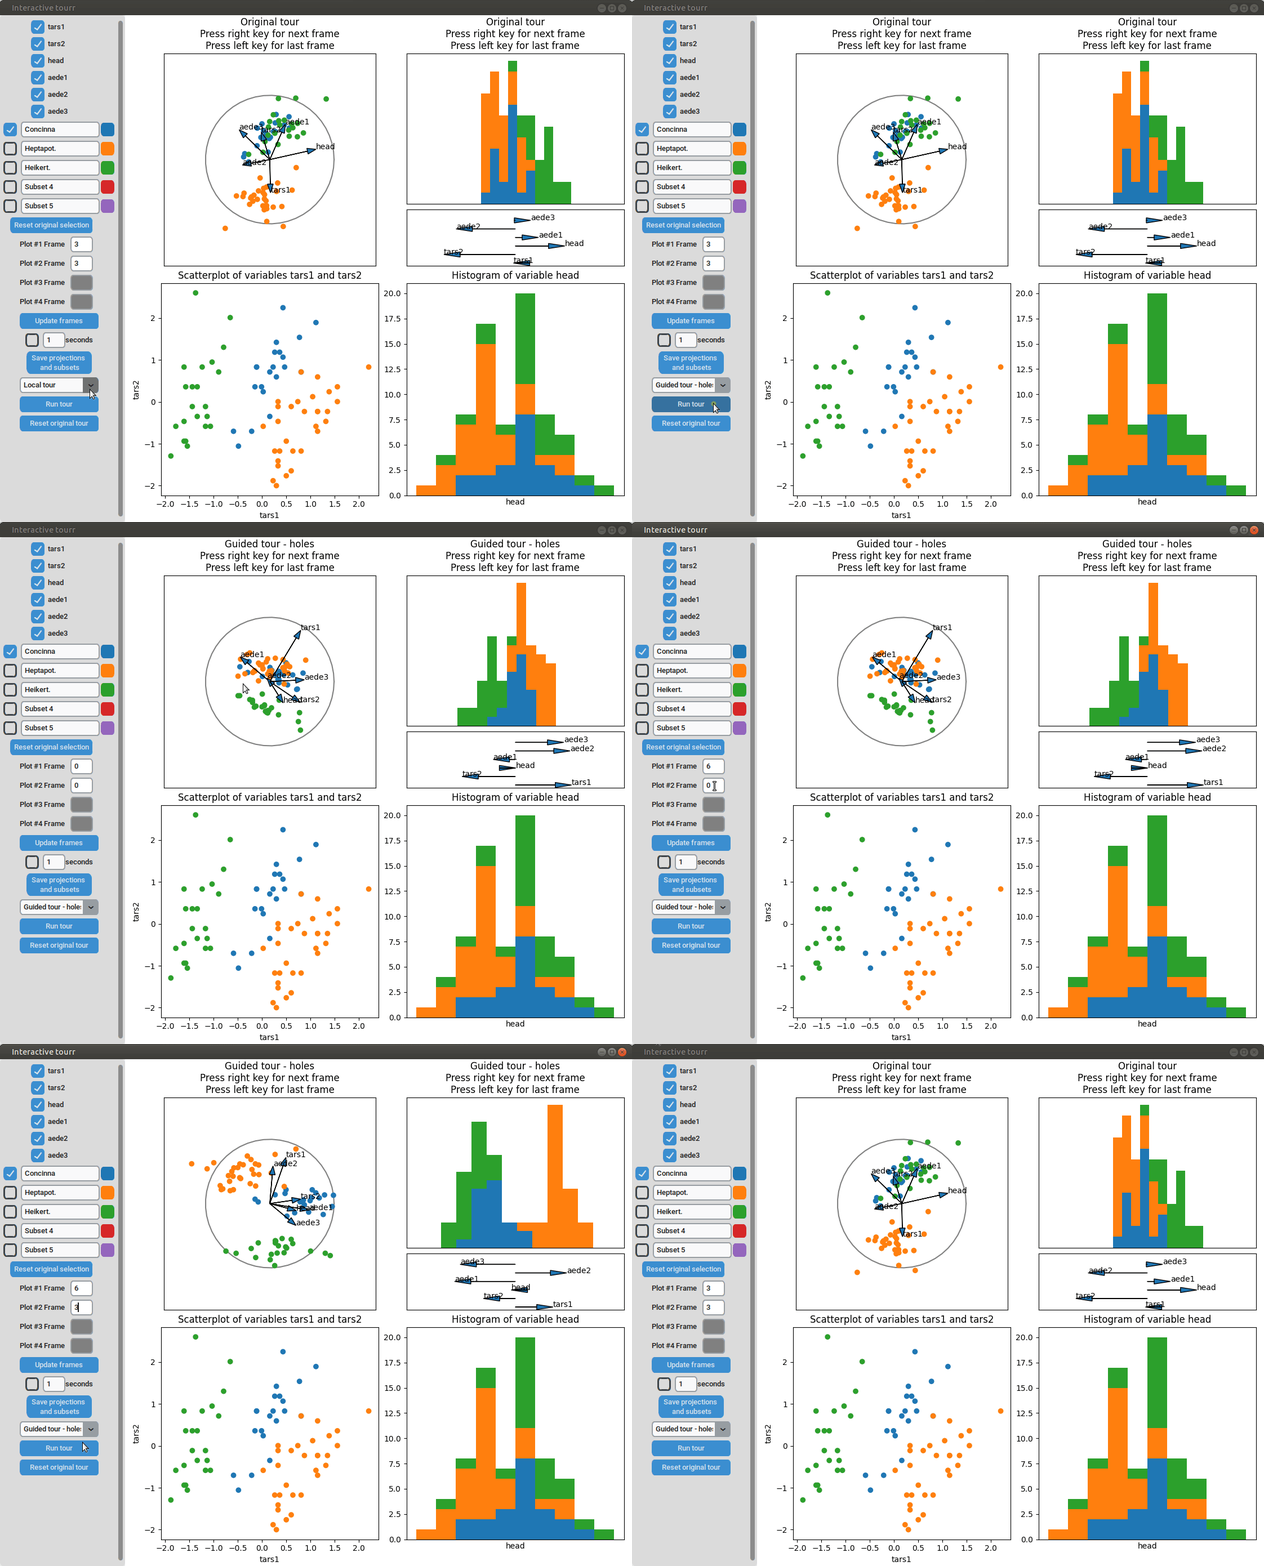
### Initiating new tours
New tours can be initiated by first choosing what tour one wants to
compute and then pressing "Run tour". Currently, local tours and guided
tours with the indices
[holes](https://ggobi.github.io/tourr/reference/holes.html) and
[LDA](https://ggobi.github.io/tourr/reference/lda_pp.html) are
available. Local tours will be initiated with the currently displayed
projections. They can therefore be used to further explore projections
similar to the displayed one. By pressing "Reset original tour" one can
return to the originally loaded tours.
{width=100%}