
The Market Reporter
Published Weekly by the
United States Department of Agriculture
Bureau of Markets and Crop Estimates
| Washington, D. C. | OCTOBER 8, 1921. | Vol. 4, No. 15 |
The Project Gutenberg EBook of The Market Reporter, by Various

This eBook is for the use of anyone anywhere in the United States and
most other parts of the world at no cost and with almost no restrictions
whatsoever.  You may copy it, give it away or re-use it under the terms
of the Project Gutenberg License included with this eBook or online at
www.gutenberg.org.  If you are not located in the United States, you'll
have to check the laws of the country where you are located before using
this ebook.


Title: The Market Reporter
       Vol. 4, No. 15

Author: Various

Release Date: December 9, 2018 [EBook #58445]

Language: English

Character set encoding: ISO-8859-1

*** START OF THIS PROJECT GUTENBERG EBOOK THE MARKET REPORTER ***


Produced by The Online Distributed Proofreading Team at
http://www.pgdp.net (This file was produced from images
generously made available by The Internet Archive)
Please see the Transcriber’s Notes at the end of this text.
Published Weekly by the
United States Department of Agriculture
Bureau of Markets and Crop Estimates
| Washington, D. C. | OCTOBER 8, 1921. | Vol. 4, No. 15 |
The movement of red clover seed from growers’ hands has been below normal, but that of alsike clover has been fully normal, according to reports received by the Bureau of Markets and Crop Estimates during the week ending Oct. 1. There is a tendency on the part of the growers of red clover seed to hold their seed because the crop, which is now being thrashed in many sections, is not turning out any better than was expected at harvest time and as reported in The Market Reporter for Sept. 10.
Although clover prices on Sept. 27 were mostly 50¢ to $1 per 100 lbs. lower than they were a month ago, they have shown little or no change during the past week or ten days. The quality of red and alsike clover is about equal or slightly inferior to that of last year’s stock. Rains during the last two weeks of September have discolored or bleached much of the seed in some sections.
Red Clover.—In a number of important sections only 5 to 25% of the red clover seed crop had been sold by growers at the end of September. This season’s movement, however, has exceeded the belated movement of the 1920 crop, but has been a little slower than usual. Growers see evidences of a short crop in their immediate vicinity, and in view of the fact that prices offered are on an average $2 to $4 per 100 lbs. lower than last year, and $25 to $28 lower than two years ago at a corresponding time, they are not inclined to sell freely. In a few sections, particularly southwestern Ohio and southeastern Iowa, the movement has been considerably above normal, the growers already having sold 45% and 35%, respectively, of their crops.
The average prices offered to growers in various sections on Sept. 27 for clean seed, as shown in the accompanying table, ranged from $14.60 per 100 lbs. in southwestern Iowa to $17.25 in southwestern Ohio, compared with a range of $17.25 to $22 at a corresponding time last year.
The imports of red clover seed during July, August, and September totaled 1,792,900 lbs. compared with 305,200 lbs. during the same months a year ago. These heavy imports of old seed from Europe and South America have tended to depress prices for domestic seed. French, German, and Italian correspondents state that large quantities of red clover seed were sold during July and August and consequently stocks of old seed have been reduced greatly. The 1921 crop in these and other European countries was reported to be much below normal because of the drought during the summer, and it will be needed for sowing the acreage there next spring.
The quality of the seed in this country varies considerably in different sections, being better than last year in southern Wisconsin, Ohio, Minnesota, South Dakota, and Idaho and somewhat poorer in central Illinois, and Indiana, Michigan, and parts of other States.
Alsike Clover.—In practically all of the important producing sections a larger percentage of the crop had left growers’ hands by Oct. 1 than on the same date last year. It is estimated that about two-fifths of the marketable surplus had been sold by growers by that date. On Sept. 27 growers were being offered $13.05 to $16 per 100 lbs. for clean seed compared with prices a year ago of $18.40 to $24.50 and two years ago of $36.20 to $40.
Most of the reports indicated that the quality of the 1921 crop was approximately the same as that of last year; the reports indicating a difference in quality between the 1921 and 1920 crops were about equally divided, some stating that the quality was better and others stating that it was inferior.
The imports of alsike clover seed from July 1 to Sept. 30 were 1,106,700 lbs., compared with 109,700 lbs. for the same period last year. The crop in Ontario, Canada, which contributes the large bulk of the alsike clover seed that is annually imported into this country is less than normal and is estimated to be 60% of the 1920 crop. The decreased production of this seed in the United States and Canada has caused prices to remain rather firm since harvest.
| Red Clover Seed Prices and Movement. | ||||||
|---|---|---|---|---|---|---|
| State or section. |
Prices offered growers per 100 lbs., basis clean seed. |
Percentage of 1921, 1920, and 1919 crops sold by growers by— |
||||
| Sept. 27, 1921. |
Oct. 5, 1920. |
Sept. 30, 1919. |
Sept. 27, 1921. |
Oct. 5, 1920. |
Sept. 30, 1919. |
|
| P. ct. | P. ct. | P. ct. | ||||
| Michigan | $16.10 | $20.50 | $43.40 | 5 | 5 | 2 |
| N. Illinois | 15.40 | 21.00 | ... | 5 | 10 | 12 |
| C. Illinois | 15.75 | 19.50 | 42.90 | 25 | 15 | 65 |
| N. Indiana | 16.70 | 19.65 | 41.75 | 25 | 15 | 50 |
| C. Indiana | 16.40 | 19.40 | ... | 30 | 10 | 15 |
| S. Indiana | 15.80 | 17.25 | ... | 20 | 10 | 10 |
| NW. Ohio | 15.75 | 20.00 | 44.50 | 45 | 8 | 20 |
| SW. Ohio | 17.25 | 21.75 | ... | 5 | 9 | ... |
| Minnesota | 15.65 | 20.10 | 43.75 | 10 | 3 | 15 |
| W. Wisconsin | 16.05 | 19.80 | ... | 5 | 5 | 10 |
| E. Wisconsin | 17.20 | 20.50 | ... | 5 | 5 | 5 |
| S. Wisconsin | 16.90 | 20.90 | 44.20 | 15 | 6 | 35 |
| Idaho | 15.00 | 22.00 | 43.70 | 10 | 6 | 20 |
| Nebraska | 15.00 | 20.00 | 43.15 | 5 | 4 | 20 |
| Kansas | 14.75 | 17.75 | ... | 15 | 2 | 35 |
| NE. Iowa | 15.50 | 20.00 | ... | 20 | 17 | 5 |
| SW. Iowa | 14.60 | 19.50 | ... | 10 | 5 | 30 |
| SE. Iowa | 15.10 | 21.00 | 41.00 | 35 | 5 | 35 |
| Missouri | 15.90 | 18.75 | ... | 15 | 6 | 50 |
| Alsike Clover Seed Prices and Movement. | ||||||
| P. ct. | P. ct. | P. ct. | ||||
| Michigan | $15.15 | $20.40 | $38.00 | 15 | 6 | 55 |
| N. Illinois | 13.90 | 20.90 | ... | 40 | 11 | 85 |
| C. Illinois | 13.85 | 18.40 | 40.00 | 20 | 20 | 65 |
| N. Indiana | 13.95 | 19.80 | ... | 60 | 36 | 50 |
| C. Indiana | 14.25 | 20.25 | 40.00 | 50 | 14 | 10 |
| NW. Ohio | 13.05 | 21.70 | 38.70 | 60 | 16 | 85 |
| SW. Ohio | 14.45 | 22.90 | ... | 15 | 7 | ... |
| New York | 16.00 | 23.25 | ... | 35 | 5 | 45 |
| W. Wisconsin | 14.00 | 20.30 | ... | 5 | 8 | 45 |
| E. Wisconsin | 14.50 | 21.70 | ... | 15 | 10 | ... |
| S. Wisconsin | 14.60 | 24.50 | 36.20 | 40 | 20 | 35 |
| Idaho | 16.00 | 23.00 | 39.50 | 70 | 10 | 60 |
| Oregon | 14.25 | 22.75 | ... | 60 | 10 | 35 |
Heavy receipts featured the week’s live-stock trading. The trend of cattle prices was decidedly irregular. The hog market had a fairly healthy tone. Sheep and lamb trade showed some improvement. The fresh meat trade throughout the month of September was narrow (pp. 226 and 228).
Prices of wheat and corn futures declined steadily throughout the week, but cash premiums strengthened in all markets excepting Minneapolis (p. 234).
The movement of fruits and vegetables was near the peak of the season, and prices declined (p. 230).
Definite information concerning volume of Danish imports steadied the butter market. Cheese markets were steady under improved demand (p. 233).
Hay continued in light supply and prices in most markets were unchanged. General inactivity continued in feed markets, wheat mill feeds registering extreme Weakness (p. 236).
Prices of spot and future cotton continued to advance. Production estimated at only 6,537,000 bales (p. 238).
The monthly Wool consumption report appears on page 239.
The monthly table showing carload shipments of fruits and vegetables appears on page 232.
The movement of unsweetened evaporated milk in cases during August was considerably larger than that of sweetened condensed milk, and the tone of the market for the former class of goods was proportionately better, as shown by a review of the latest available reports from milk manufacturers. The demand for bulk goods has decreased materially with the approach of cooler weather, especially the demand from the ice-cream trade.
Manufacturers’ reports of total stocks on hand Sept. 1 indicate approximately the same surplus of condensed case goods as on Aug. 1, but show a decrease of over 35% in the quantities of evaporated case goods. A similar condition prevailed with regard to unsold stocks, supplies of condensed case goods being practically the same as on Aug. 1, while stocks of unsold evaporated case goods decreased almost 50%. Stocks of case goods of both condensed and unsweetened evaporated milk on Sept. 1 were less than one-half the quantity reported on hand Sept. 1, 1920.
The export movement during August apparently served to give considerable relief to the general situation. Exports totaling 22,803,000 lbs. of evaporated milk more than doubled the July exports. Exports of condensed milk were but 7,557,000 lbs., although this was 2,000,000 lbs., heavier than in July. The United Kingdom received the heaviest shipments, 12,716,000 lbs. of evaporated and 3,232,000 lbs. of condensed going to that country. France and Germany each received approximately 3,000,000 lbs. of evaporated milk.
Exports of condensed milk during the first eight months of 1921 were but 62,000,000 lbs., compared with more than 221,000,000 lbs. during the same period in 1920, while exports of 116,000,000 lbs. of evaporated milk this year are 5,000,000 lbs. heavier than the shipments in 1920.
Manufacturers’ selling prices to the domestic trade during August remained practically the same as during July, but reductions occurred in prices to foreign trade. The largest cuts averaging 34¢ per case were made in export prices of sweetened condensed milk. Unsweetened evaporated milk prices to foreign trade were not so generally reduced, as some manufacturers seem to have advanced export prices slightly, with the result that the average export price was but 4¢ less per case than during the previous month.
Wholesale Prices of Condensed and Evaporated Milk.
(To domestic trade.)
| Geographic section. |
Sweetened condensed case of 14-oz. cans. |
Unsweetened evaporated case of 16-oz. cans. |
||
|---|---|---|---|---|
| Aug. | July. | Aug. | July. | |
| New England | $6.07 | $6.16 | $4.82 | $4.83 |
| Middle Atlantic | 5.95 | 5.89 | 4.88 | 4.79 |
| South Atlantic | 6.47 | 6.47 | 5.02 | 4.97 |
| East North Central | 6.41 | 6.48 | 4.52 | 4.64 |
| West North Central | 6.38 | 6.44 | 4.76 | 4.75 |
| South Central | 6.49 | 6.53 | 4.91 | 5.05 |
| Western (North) | 6.38 | 6.33 | 4.72 | 4.61 |
| Western (South) | 6.53 | 6.37 | 4.78 | 4.67 |
| United States | 6.28 | 6.26 | 4.83 | 4.78 |
Prices to Producers at Condenseries for 3.5% Milk.
(Per 100 lbs.)
| Geographic section. |
By manufacturers of case and bulk goods. |
By manufacturers of bulk goods only. |
||
|---|---|---|---|---|
| Sept. | Aug. | Sept. | Aug. | |
| New England | $1.91 | $1.91 | $3.30 | $3.30 |
| Middle Atlantic | 2.23 | 2.06 | 2.17 | 2.14 |
| South Atlantic | 2.15 | 1.88 | 1.66 | 1.87 |
| East North Central | 1.84 | 1.85 | 1.88 | 1.87 |
| West North Central | 1.80 | 1.80 | 1.77 | 1.40 |
| Western (North) | 1.77 | 1.53 | 2.23 | 2.30 |
| Western (South) | 1.73 | 1.61 | ... | ... |
| United States | 1.87 | 1.87 | 2.04 | 2.06 |
Stocks and Exports of Condensed and Evaporated Milk.
[In thousands of pounds; i. e., 000 omitted.]
| Stocks. | Sept. 1, 1921. |
Aug. 1, 1921. |
Sept. 1, 1920. |
|||
|---|---|---|---|---|---|---|
| Case goods. |
Bulk goods. |
Case goods. |
Bulk goods. |
Case goods. |
Bulk goods. |
|
| CONDENSED. | ||||||
| Total stocks | 31,773 | 26,654 | 30,541 | 28,529 | 71,341 | 32,766 |
| Total unsold stocks | 21,574 | 19,074 | 21,588 | 24,476 | 58,577 | 8,733 |
| Total unfilled orders | 339 | ... | 425 | 14 | 300 | ... |
| EVAPORATED. | ||||||
| Total stocks | 90,503 | 770 | 145,867 | 739 | 170,198 | 851 |
| Total unsold stocks | 36,149 | 763 | 68,658 | 719 | 103,812 | 738 |
| Total unfilled orders | 6,039 | ... | 10,025 | ... | 3,482 | ... |
| Exports. | Aug., 1921. |
July, 1921. |
Aug., 1920. |
|---|---|---|---|
| Condensed milk | 7,557 | 5,727 | 20,503 |
| Evaporated milk | 22,803 | 11,611 | 5,100 |
| Total | 30,360 | 17,338 | 25,603 |

(Chicago, East St. Louis, Kansas City, Omaha, and St. Paul.)
Receipts of live stock during the closing week of September were of generous volume despite the fact that conditions in some departments of the trade during the preceding week bordered on demoralization. An increased proportion of trashy, light-weight cattle indicated that producers were anxious to liquidate surplus holdings before stormy weather sets in, while a corresponding decrease in receipts of corn-feds suggested a decreased number of well-conditioned beef cattle in feeders’ hands.
Chicago’s cattle receipts for the week were the largest since January, while the combined ten-market supply of about 242,300 cattle was practically the same as the week previous but 41,000 short of the corresponding week a year ago.
Following the descent of hog prices during the preceding week to the lowest levels of the year, the marketward movement of hogs expanded materially, the ten-market total at approximately 436,000 being 40,000 in excess of the week previous, and nearly 60,000 greater than the same week last year. The hog run, while continuing to carry an abnormally large proportion of heavy packing sows for this period of the year, showed a considerably enlarged quota Of spring-farrowed, light and underweight stock and average weights decreased at most points. The disposition shown by producers in many sections to unload pigs and immature light hogs was anything but a bullish influence on prices but a revival of eastern shipping demand assisted in checking the decline.
Receipts of sheep and lambs for the week both at Chicago and numerous other western points were the largest of the year, the ten-market total of about 419,500 exceeding the previous week’s supply by approximately 38,000 and being nearly 1,000 in excess of those of the same week last year. The crop, however, carried a heavy proportion of feeders from the western range and the market displayed gratifying stability following the slump in prices during the week previous, which was one of the most severe slumps of the season.
Cattle.—Higher prices for most grades of beef steers showing effective corn feeding, further seasonal expansion in the movement of both native and western grass cattle, and further evidences of increasing interest on the part of stocker and feeder buyers featured the cattle trade during the week under review. The trend of prices at the different market centers was decidedly irregular. Omaha, where receipts were considerably lighter than the preceding week, showed advances on practically all classes of cattle. Other River markets under review showed irregular declines on grass cattle and comparatively little change on desirable corn-feds. At Chicago, where receipts of northwestern range cattle were nearly double the largest previous run this season, grass steers and the less desirable of the warmed-up and plain, heavy, fed steers sold steady to 25¢ lower, and the better grades of corn-fed steers, including yearlings, all the way from 10¢ to 50¢ higher.
The return of $11 cattle after an absence dating back to last January, marked the week’s trading at Chicago. Two lots of prime Angus and Hereford yearlings averaging 985 lbs. and 891 lbs., respectively, brought that price. The former consignment was made up of natives from an Iowa feed lot, nearly half of which were heifers. The other lot consisted of Illinois-fed, branded steers which originally came from Texas.
The popularity at all market centers of well-finished yearlings on the baby beef order and of finished 1,100-lb. to 1,300-lb. steers over the weighty and more aged bullocks was as pronounced as ever, and the price premiums earned by the former were unprecedented for this season of the year. Thick-fat 1,400-lb. to 1,500-lb. steers of high quality and closely approaching prime grade could not pass $9.25 at Chicago and contrasted oddly with the moderately fat, short-fed yearlings that brought about the same figure. Ripe steers in the 1,600-lb. to 1,760-lb. class that had been grain-fed a year or more, sold at Chicago and Omaha at $8.25 to $8.50 with a plainer, weighty kind that had consumed considerable corn, down to $7.50. Many sales of good and choice 1,200-lb. to 1,350-lb. steers between $8 and $8.75 were made at Chicago and elsewhere. A few loads of long yearlings averaging 1,100 lbs. to 1,175 lbs. sold as high as $10 and $10.50.
A generous proportion of the run, however, all around the western market circuit consisted of branded and native grass steers of mediocre and medium killing quality that cashed at $5 to $6.50, comparatively few straight grass steers being good enough to bring $7. This was true despite the fact that two loads of Montanas reached $7.25 at Chicago. Light grass steers of common quality but carrying enough flesh to make cheap carcass beef, sold as low as $4.25 and $4.50 at St. Paul and Missouri River points and a few, chiefly on the Mexican order, ranged downward from $5 at Chicago.
An increase of nearly 50% in receipts of northwestern grass cattle at Chicago was credited in part to the 20% cut in long-haul freight rates. The week’s total of about 13,000 cattle from that source, however, was but little more than half as large as similar receipts during the corresponding week last year. It seems probable, however, that the Northwest will ship more freely during October, as after this month stormy weather is likely to put an end to cattle roundups.
Liberal receipts of low and medium grade steers and their cheapness “on the hooks” as compared with most grades of she stock had a depressing effect on cow and heifer prices at all markets covered by this report except Omaha. At the latter market light receipts forced cow prices up along with those of most other classes of cattle. Canners and choice dry-fed heifer yearlings withstood the downward tendency and held about steady.
The break in she-stock prices ranged anywhere from 25¢. to $1. Declines were most severe at Chicago, where medium to good grades of fat cows and the same classes of grass heifers frequently showed a break of 75¢. to $1 compared with the previous week-end. A spread of $3.75 to $5.75 took the big end of the week’s supply of grass cows and heifers, while canners and cutters ranged largely from $2.25 to $3.25. The best of the light, corn-fed heifer yearlings sold well in line with finished steer yearlings, but they had to be of the baby-beef type. Owing to scarcity of corn-fed cows and a slackened demand for kosher cows due to the approaching Jewish holidays, few heavy cows were good enough to bring $6 at any of the large western markets.
Bulls sold steady to lower at most points, while calves were sharply lower at both Chicago and St. Paul, little changed at Kansas City and St. Louis, and higher at Omaha because of meager receipts.
The demand for stock and feeding cattle, which has been gaining breadth during recent weeks, was comparatively liberal during the closing week of September and the total movement to the country was the largest of the year to date. Except Omaha, where stocker and feeder cattle shared in the general price upturn, prices of such cattle at points under review were at the lowest levels of the year to date. Well-bred yearlings and light feeders were in strongest demand.
With the exception of a few steers on the fat cattle order, few cattle went to the country costing over $6.75. The bulk of the feeder steers sold within a range of $5.25 to $6.25 and stockers largely between $5 and $6. Some of the best stock steers, however, sold right up with the choice heavy feeders and many plain and common light stockers sold downward from $4.50. Kansas City reported a fully steady market for stock cows and heifers with a good many cows going out at $3.50 to $4, and many stock heifers at $4 to $5 with a few as high as $5.50.
RECEIPTS, SHIPMENTS, AND LOCAL SLAUGHTER FOR THE WEEK ENDING OCT. 1.
| Markets. | Cattle and calves. | Hogs. | Sheep. | ||||||
|---|---|---|---|---|---|---|---|---|---|
| Re- ceipts. |
Ship- ments. |
Local slaugh- ter. |
Re- ceipts. |
Ship- ments. |
Local slaugh- ter. |
Re- ceipts. |
Ship- ments. |
Local slaugh- ter. |
|
| Chicago | 79,076 | 25,332 | 53,744 | 126,432 | 27,148 | 99,284 | 148,779 | 57,903 | 90,876 |
| Denver[1] | 9,482 | 7,767 | 2,272 | 2,793 | ... | 2,675 | 44,713 | 34,469 | 4,086 |
| East St. Louis | 30,067 | 14,640 | 10,101 | 48,094 | 17,536 | 22,904 | 7,434 | 1,081 | 4,062 |
| Indianapolis[1] | 9,533 | 4,398 | 4,919 | 60,437 | 32,349 | 27,399 | 2,823 | 1,547 | 1,323 |
| Kansas City | 78,446 | 43,851 | 31,002 | 28,914 | 8,109 | 20,926 | 47,121 | 12,179 | 24,234 |
| Oklahoma City | 7,767 | 2,509 | 4,557 | 4,574 | 272 | 4,142 | 165 | ... | 165 |
| Omaha | 35,557 | 23,657 | 11,900 | 30,607 | 5,687 | 24,920 | 126,966 | 73,496 | 53,470 |
| St. Joseph[1] | 13,639 | 5,006 | 9,101 | 21,122 | 2,953 | 17,541 | 28,565 | 8,123 | 17,545 |
| St. Paul[1] | 24,301 | 13,023 | 12,163 | 31,339 | 4,445 | 27,035 | 19,209 | 6,823 | 12,381 |
| Sioux City | 15,032 | 11,659 | 4,296 | 28,068 | 9,874 | 16,285 | 8,242 | 4,293 | 4,564 |
| Wichita[1] | 7,554 | 5,422 | 2,415 | 4,236 | 127 | 4,270 | 399 | 251 | 169 |
| Total | 310,456 | 157,264 | 146,470 | 356,616 | 108,560 | 267,381 | 434,416 | 260,165 | 222,875 |
| Previous week | 324,438 | 153,997 | 154,269 | 373,574 | 100,615 | 258,235 | 403,963 | 169,947 | 213,446 |
[1] Week ending Friday, Sept. 30.
DAILY AVERAGE WEIGHT AND COST OF HOGS FOR WEEK ENDING OCT. 1.
[Price per 100 lbs.]
| Mon. | Tues. | Wed. | Thurs. | Fri. | Sat. | This wk. | Last wk. | 1 yr. ago. | ||||||||||
|---|---|---|---|---|---|---|---|---|---|---|---|---|---|---|---|---|---|---|
| Wt. | Cost. | Wt. | Cost. | Wt. | Cost. | Wt. | Cost. | Wt. | Cost. | Wt. | Cost. | Wt. | Cost. | Wt. | Cost. | Wt. | Cost. | |
| Chicago | 272 | $7.10 | 255 | $7.29 | 262 | $7.31 | 246 | $7.30 | 246 | $7.43 | 280 | $7.06 | 259 | $7.25 | 263 | $7.42 | 247 | $15.74 |
| E. St. Louis | 195 | 8.22 | 188 | 8.16 | 188 | 8.16 | 204 | 8.00 | 209 | 7.94 | 201 | 8.10 | 198 | 8.10 | 192 | 8.17 | 196 | 16.35 |
| Kansas City | 209 | 7.53 | 209 | 7.52 | 209 | 7.54 | 225 | 7.35 | 221 | 7.23 | 270 | 7.33 | 213 | 7.46 | 213 | 7.77 | 220 | 15.79 |
| Omaha | 304 | 6.41 | 292 | 6.61 | 289 | 6.84 | 300 | 6.44 | 290 | 6.96 | 292 | 6.41 | 294 | 6.55 | 299 | 6.86 | 273 | 15.72 |
| S. St. Paul | 243 | 6.58 | 235 | 6.83 | 245 | 6.95 | 236 | 6.95 | 246 | 7.20 | 211 | 7.02 | 240 | 6.86 | 236 | 7.16 | ... | ... |
| The above prices are computed on packer and shipper purchases. | ||||||||||||||||||
| Mon. | Tues. | Wed. | Thurs. | Fri. | ||||||
|---|---|---|---|---|---|---|---|---|---|---|
| Wt. | Cost. | Wt. | Cost. | Wt. | Cost. | Wt. | Cost. | Wt. | Cost. | |
| Chicago | 272 | $7.10 | 255 | $7.29 | 262 | $7.31 | 246 | $7.30 | 246 | $7.43 |
| E. St. Louis | 195 | 8.22 | 188 | 8.16 | 188 | 8.16 | 204 | 8.00 | 209 | 7.94 |
| Kansas City | 209 | 7.53 | 209 | 7.52 | 209 | 7.54 | 225 | 7.35 | 221 | 7.23 |
| Omaha | 304 | 6.41 | 292 | 6.61 | 289 | 6.84 | 300 | 6.44 | 290 | 6.96 |
| S. St. Paul | 243 | 6.58 | 235 | 6.83 | 245 | 6.95 | 236 | 6.95 | 246 | 7.20 |
| Sat. | This wk. | Last wk. | 1 yr. ago. | |||||
|---|---|---|---|---|---|---|---|---|
| Wt. | Cost. | Wt. | Cost. | Wt. | Cost. | Wt. | Cost. | |
| Chicago | 280 | $7.06 | 259 | $7.25 | 263 | $7.42 | 247 | $15.74 |
| E. St. Louis | 201 | 8.10 | 198 | 8.10 | 192 | 8.17 | 196 | 16.35 |
| Kansas City | 270 | 7.33 | 213 | 7.46 | 213 | 7.77 | 220 | 15.79 |
| Omaha | 292 | 6.41 | 294 | 6.55 | 299 | 6.86 | 273 | 15.72 |
| S. St. Paul | 211 | 7.02 | 240 | 6.86 | 236 | 7.16 | ... | ... |
| The above prices are computed on packer and shipper purchases. | ||||||||
Hogs.—The hog market had a fairly healthy tone and the erratic fluctuations which marked the trade for several weeks previous were, for the most part, missing. While during the preceding week, average cost of hogs at the markets under review showed a decrease, Chicago prices dropping to the lowest levels since early in 1916, closing prices of the week under review were generally 10¢ to 15¢ higher than the previous week-end. A broader eastern demand was partly responsible for the advance.
While the proportion of new crop hogs showed a seasonal increase at practically all points, the continued heavy receipts of packing sows caused considerable comment. Traders at Chicago do not recall any recent period when receipts at this time of the year carried so large a percentage of packing sows as do current offerings. Packing sows were of almost uniformly good quality, many of them being almost as smooth as barrows. Several of the smaller packers at Chicago turned from heavy barrows to good and choice sows.
Many of the new-crop hogs showed very little finish and buyers complained that many were “dopey” apparently suffering from the effects of initial rations of new corn. On almost every day butcher hogs averaging 200 lbs. to 240 lbs. sold at top prices at Chicago, while the 160-lb. to 170-lb. kinds closed considerably under top quotations.
The closing top at Chicago was $8.30 with the average cost that day $7.06. The average cost of packing and shipping droves for the week at that point was $7.25, with the average weight at 259 lbs., the lightest since the week ending Aug. 6. The closing top at East St. Louis was $8.35, at Kansas City $7.65, at Omaha $7.75, and at St. Paul $7.60.
Sheep.—Considering supplies, which at leading western markets were the heaviest of the year, sheep and lamb trade during the final week of September showed some improvement. Receipts at Chicago were larger than during any previous week since 1919 and range lambs, carrying the largest proportion of feeders of the season, were greatly in the majority.
In the fat classes, supply and demand were evenly balanced and as the feeder outlet developed considerable breadth, closing prices on all classes were practically steady with the close of the week previous.
Sheep were generally steady at all points except Kansas City, where prices worked 25¢ to 50¢ higher on fat classes. Fat lambs closed lower for the week at Omaha and higher at East St. Louis but were little changed elsewhere. Feeder classes sold steady to somewhat higher at all points. The range movement started early this summer and the early season output of feeders was small.
Opening, Oct. 3.—Beef steers were strong to 25¢ higher at Chicago with desirable corn-feds gaining most. River markets were generally steady to strong on corn-feds and slow to lower on grassers. The week opened with a big run of 35,000 cattle at Kansas City. Chicago’s receipts at 20,000 cattle were well below expectations and the supply of good corn-fed cattle showed a marked decrease. Top yearlings reached $11.15 at Chicago, the highest point reached since early in January and within 10¢ of the top for the year on yearlings.
With receipts moderate, hog prices were generally strong to 15¢ higher. East St. Louis reported a 15¢ to 25¢ advance with top hogs at $8.55. At Chicago the top was $8.45 and at Omaha $8, at Kansas City $7.90 and at St. Paul $7.50.
Fat sheep and lambs opened generally steady to 25¢ higher. Western fat lambs topped at $9 at Chicago, $8.50 at Omaha, and $8.40 at Kansas City. Fat natives reached $8.50 at Chicago. The fat ewe top was $4.75 at Chicago, $4.50 at East St. Louis, and $4.25 at Omaha. Best feeder lambs brought $7.25 at Chicago on a firm market and $7 at Omaha.
LIVE STOCK PRICES, TUESDAY, OCT. 4.
[Per 100 lbs.]
| Chicago. | East St. Louis. |
Kansas City. |
Omaha. | St. Paul. | |||||||||||||
|---|---|---|---|---|---|---|---|---|---|---|---|---|---|---|---|---|---|
| HOGS. | |||||||||||||||||
| Top | $8.55 | $8.65 | $8.10 | $8.10 | $7.75 | ||||||||||||
| Bulk of sales | 6.65 | - | 8.40 | 8.25 | - | 8.65 | 7.25 | - | 8.00 | 6.25 | - | 7.50 | 6.50 | - | 7.75 | ||
| Heavy (250 lbs. up), medium-choice | 7.60 | - | 8.40 | 7.50 | - | 8.55 | 7.15 | - | 8.00 | 6.75 | - | 7.50 | 6.75 | - | 7.50 | ||
| Medium (200-250 lbs.), common-choice | 8.20 | - | 8.50 | 8.40 | - | 8.65 | 7.35 | - | 8.10 | 7.00 | - | 8.00 | 6.85 | - | 7.75 | ||
| Light (150-200 lbs.), common-choice | 7.85 | - | 8.50 | 8.25 | - | 8.65 | 7.00 | - | 8.10 | 7.35 | - | 8.10 | 7.35 | - | 7.75 | ||
| Light lights (130-150 lbs.), common-choice | 7.65 | - | 8.20 | 8.15 | - | 8.50 | 6.75 | - | 7.85 | ... | ... | ||||||
| Packing sows (250 lbs. up), smooth | 6.65 | - | 7.25 | 6.25 | - | 6.75 | 6.25 | - | 7.00 | 6.15 | - | 6.65 | 6.25 | - | 6.85 | ||
| Packing sows (250 lbs. up), rough | 6.25 | - | 6.65 | 5.75 | - | 6.25 | 5.50 | - | 6.25 | 5.75 | - | 6.15 | 6.00 | - | 6.40 | ||
| Pigs (150 lbs. down), common-choice | 7.10 | - | 7.75 | 7.65 | - | 8.30 | ... | ... | ... | ||||||||
| Stock pigs (130 lbs. down) | ... | 6.75 | - | 8.25 | 6.50 | - | 8.35 | 7.00 | - | 8.00 | 7.50 | - | 8.25 | ||||
| CATTLE. | |||||||||||||||||
| Beef steers: | |||||||||||||||||
| Medium and heavy (1,100 lbs. up)— | |||||||||||||||||
| Choice and prime | 8.85 | - | 10.90 | 8.75 | - | 10.00 | 8.50 | - | 10.00 | 8.50 | - | 9.75 | ... | ||||
| Good | 8.25 | - | 9.65 | 8.25 | - | 9.25 | 7.00 | - | 9.00 | 7.75 | - | 8.50 | 7.75 | - | 8.75 | ||
| Medium | 6.00 | - | 8.75 | 5.25 | - | 8.25 | 5.25 | - | 7.25 | 5.50 | - | 7.75 | 6.00 | - | 7.75 | ||
| Common | 5.00 | - | 6.00 | 4.50 | - | 5.25 | 4.35 | - | 5.25 | 4.25 | - | 5.50 | 4.25 | - | 5.75 | ||
| Light weight (1,100 lbs. down)— | |||||||||||||||||
| Choice and prime | 10.25 | - | 11.25 | 9.75 | - | 11.00 | 9.50 | - | 10.35 | 9.75 | - | 10.75 | ... | ||||
| Good | 9.00 | - | 10.25 | 8.50 | - | 9.75 | 7.10 | - | 9.50 | 7.50 | - | 9.75 | 8.50 | - | 9.50 | ||
| Medium | 6.00 | - | 9.00 | 4.75 | - | 8.50 | 5.00 | - | 7.40 | 5.25 | - | 7.50 | 6.00 | - | 8.50 | ||
| Common | 4.75 | - | 6.00 | 4.00 | - | 4.75 | 4.00 | - | 5.00 | 4.00 | - | 5.25 | 4.00 | - | 6.00 | ||
| Butcher cattle: | |||||||||||||||||
| Heifers, common-choice | 4.25 | - | 9.25 | 4.25 | - | 10.50 | 3.75 | - | 8.00 | 4.00 | - | 8.75 | 3.50 | - | 8.75 | ||
| Cows, common-choice | 3.50 | - | 6.75 | 3.25 | - | 6.00 | 3.35 | - | 5.50 | 3.75 | - | 6.50 | 3.00 | - | 6.50 | ||
| Bulls, bologna, and beef | 3.65 | - | 6.35 | 3.25 | - | 6.25 | 3.00 | - | 5.25 | 3.00 | - | 6.25 | 2.75 | - | 5.50 | ||
| Canners and cutters: | |||||||||||||||||
| Cows and heifers | 2.50 | - | 3.50 | 2.25 | - | 3.50 | 2.00 | - | 3.35 | 2.25 | - | 3.75 | 1.75 | - | 3.00 | ||
| Canner steers | 3.00 | - | 3.50 | 2.50 | - | 3.00 | 2.50 | - | 3.25 | 2.50 | - | 3.75 | 2.25 | - | 3.00 | ||
| Veal calves: | |||||||||||||||||
| Light and medium weight, medium-choice | 5.50 | - | 11.50 | 6.00 | - | 11.50 | 7.00 | - | 10.00 | 7.00 | - | 10.00 | 5.00 | - | 9.50 | ||
| Heavy weight, common-choice | 3.50 | - | 7.00 | 3.00 | - | 7.00 | 3.00 | - | 6.50 | 3.50 | - | 7.25 | 3.00 | - | 6.00 | ||
| Feeder steers: | |||||||||||||||||
| 1,000 lbs. up, common-choice | 5.00 | - | 6.75 | 5.00 | - | 6.50 | 4.60 | - | 7.00 | 5.00 | - | 7.25 | 3.75 | - | 6.25 | ||
| 750-1,000 lbs., common-choice | 4.85 | - | 6.50 | 4.50 | - | 6.50 | 4.50 | - | 6.90 | 4.75 | - | 7.00 | 3.50 | - | 6.00 | ||
| Stocker cattle: | |||||||||||||||||
| Steers, common-choice | 3.75 | - | 6.50 | 3.50 | - | 6.50 | 3.40 | - | 6.65 | 3.75 | - | 7.00 | 3.25 | - | 6.00 | ||
| Cows and heifers, common-choice | 3.25 | - | 4.75 | 2.50 | - | 5.50 | 2.50 | - | 5.50 | 2.75 | - | 5.50 | 2.50 | - | 4.00 | ||
| Calves: | |||||||||||||||||
| Good and choice | ... | 5.25 | - | 6.25 | 5.50 | - | 6.50 | 5.75 | - | 7.25 | ... | ||||||
| Common and medium | ... | 4.00 | - | 5.00 | 3.25 | - | 5.25 | 3.75 | - | 5.75 | ... | ||||||
| SHEEP. | |||||||||||||||||
| Lambs: | |||||||||||||||||
| 84 lbs. down, medium-choice | 7.25 | - | 9.25 | 6.75 | - | 8.75 | 7.25 | - | 8.75 | 7.25 | - | 8.75 | 6.25 | - | 8.00 | ||
| Culls and common | 4.75 | - | 7.25 | 4.00 | - | 6.50 | 4.00 | - | 7.00 | 4.75 | - | 7.00 | 3.00 | - | 6.00 | ||
| Feeding lambs | 6.00 | - | 7.25 | ... | 5.25 | - | 7.00 | 6.00 | - | 7.25 | 4.50 | - | 6.50 | ||||
| Yearlings, wethers, medium-prime | 5.00 | - | 7.00 | 4.50 | - | 6.00 | 4.50 | - | 6.25 | 5.00 | - | 6.25 | 4.50 | - | 6.25 | ||
| Wethers, medium-prime | 4.00 | - | 5.50 | 3.50 | - | 5.00 | 4.00 | - | 5.25 | 4.00 | - | 5.00 | 3.25 | - | 4.75 | ||
| Ewes: | |||||||||||||||||
| Medium-good and choice | 3.00 | - | 5.00 | 3.00 | - | 4.00 | 3.25 | - | 4.60 | 3.25 | - | 4.50 | 2.75 | - | 4.00 | ||
| Culls and common | 1.50 | - | 2.75 | 1.00 | - | 2.75 | 1.00 | - | 3.00 | 1.50 | - | 3.00 | 1.00 | - | 2.75 | ||
| Breeding ewes (full mouths to yearlings) | 3.25 | - | 6.25 | ... | 3.50 | - | 5.75 | 3.50 | - | 5.25 | ... | ||||||
| Feeding ewes | ... | ... | ... | 2.75 | - | 3.50 | ... | ||||||||||
WHOLESALE PRICES OF WESTERN DRESSED MEATS, TUESDAY, OCT. 4.
[Per 100 lbs.]
| Chicago. | New York. | |||||||||||||||||||
|---|---|---|---|---|---|---|---|---|---|---|---|---|---|---|---|---|---|---|---|---|
| Oct. 4. | Sept. 27. | Sept. 6. | Oct. 4. | Sept. 27. | Sept. 6. | |||||||||||||||
| Fresh beef: | ||||||||||||||||||||
| Steers— | ||||||||||||||||||||
| Choice | $16.50 | - | 17.50 | $16.50 | - | 17.00 | $17.00 | - | 17.50 | $17.00 | - | 19.00 | $17.00 | - | 19.00 | $18.00 | - | 19.00 | ||
| Good | 15.50 | - | 16.50 | 15.50 | - | 16.50 | 15.50 | - | 16.50 | 14.00 | - | 16.00 | 14.00 | - | 16.00 | 15.00 | - | 17.00 | ||
| Medium | 12.00 | - | 14.00 | 12.00 | - | 14.00 | 11.50 | - | 14.00 | 11.00 | - | 13.00 | 12.00 | - | 13.50 | 13.00 | - | 14.00 | ||
| Common | 8.50 | - | 10.00 | 8.50 | - | 10.00 | 8.50 | - | 10.50 | 9.00 | - | 10.00 | 10.00 | - | 11.00 | 9.00 | - | 12.00 | ||
| Cows— | ||||||||||||||||||||
| Good | 11.50 | - | 12.00 | 11.50 | - | 12.00 | 11.00 | - | 11.50 | ... | 10.00 | - | 11.00 | 11.00 | - | 12.00 | ||||
| Medium | 10.00 | - | 11.00 | 10.00 | - | 11.00 | 9.50 | - | 10.50 | 9.00 | - | 10.00 | 9.00 | - | 10.00 | 9.00 | - | 10.00 | ||
| Common | 8.00 | - | 9.00 | 7.50 | - | 9.00 | 8.00 | - | 9.00 | 8.00 | - | 9.00 | 8.00 | - | 9.00 | 8.00 | - | 9.00 | ||
| Bulls— | ||||||||||||||||||||
| Common | 7.75 | - | 8.25 | 7.75 | - | 8.25 | 7.50 | - | 8.00 | 8.00 | - | 9.00 | 8.50 | - | 9.00 | 7.00 | - | 7.50 | ||
| Fresh lamb and mutton: | ||||||||||||||||||||
| Lamb— | ||||||||||||||||||||
| Choice | 17.00 | - | 18.00 | 18.00 | - | 19.00 | 19.00 | - | 20.00 | 18.00 | - | 19.00 | 19.00 | - | 20.00 | 20.00 | - | 21.00 | ||
| Good | 15.00 | - | 16.00 | 16.00 | - | 17.00 | 17.00 | - | 18.00 | 16.00 | - | 17.00 | 16.00 | - | 18.00 | 19.00 | - | 20.00 | ||
| Medium | 13.00 | - | 14.00 | 14.00 | - | 15.00 | 15.00 | - | 16.00 | 15.00 | - | 16.00 | 15.00 | - | 16.00 | 16.00 | - | 18.00 | ||
| Common | 10.00 | - | 12.00 | 10.00 | - | 12.00 | 12.00 | - | 14.00 | 10.00 | - | 14.00 | 10.00 | - | 14.00 | 10.00 | - | 15.00 | ||
| Mutton— | ||||||||||||||||||||
| Good | 9.00 | - | 10.00 | 9.00 | - | 10.00 | 10.50 | - | 11.00 | 11.00 | - | 12.00 | 12.00 | - | 13.00 | 11.00 | - | 13.00 | ||
| Medium | 7.00 | - | 8.00 | 7.00 | - | 8.00 | 9.00 | - | 10.00 | 10.00 | - | 11.00 | 10.00 | - | 11.00 | 10.00 | - | 11.00 | ||
| Common | 6.00 | - | 7.00 | 6.00 | - | 7.00 | 6.00 | - | 8.00 | 7.00 | - | 9.00 | 7.00 | - | 9.00 | 5.00 | - | 9.00 | ||
| Fresh veal: | ||||||||||||||||||||
| Choice | 19.00 | - | 20.00 | 19.00 | - | 21.00 | 20.00 | - | 22.00 | 21.00 | - | 22.00 | 23.00 | - | 25.00 | 25.00 | - | 26.00 | ||
| Good | 16.00 | - | 18.00 | 17.00 | - | 19.00 | 19.00 | - | 20.00 | 18.00 | - | 20.00 | 19.00 | - | 21.00 | 22.00 | - | 24.00 | ||
| Medium | 13.00 | - | 15.00 | 12.00 | - | 14.00 | 16.00 | - | 18.00 | 14.00 | - | 17.00 | 15.00 | - | 18.00 | 19.00 | - | 20.00 | ||
| Common | 9.00 | - | 12.00 | 8.00 | - | 11.00 | 12.00 | - | 15.00 | 8.00 | - | 10.00 | 9.00 | - | 12.00 | 14.00 | - | 17.00 | ||
| Fresh pork cuts: | ||||||||||||||||||||
| Loins— | ||||||||||||||||||||
| 8-10 lbs. average | 24.00 | - | 26.00 | 25.00 | - | 27.00 | 29.00 | - | 30.00 | 27.00 | - | 28.00 | 23.00 | - | 30.00 | 29.00 | - | 30.00 | ||
| 10-12 lbs. average | 20.00 | - | 22.00 | 21.00 | - | 23.00 | 27.00 | - | 28.00 | 25.00 | - | 26.00 | 27.00 | - | 20.00 | 26.00 | - | 28.00 | ||
| 12-14 lbs. average | 18.00 | - | 20.00 | 18.00 | - | 20.00 | 22.00 | - | 25.00 | 21.00 | - | 23.00 | 24.00 | - | 25.00 | 23.00 | - | 25.00 | ||
| 14-16 lbs. average | 16.00 | - | 18.00 | 16.00 | - | 18.00 | 19.00 | - | 21.00 | 18.00 | - | 20.00 | 18.00 | - | 20.00 | 20.00 | - | 21.00 | ||
| 16 lbs. and over | 12.00 | - | 15.00 | 13.00 | - | 15.00 | 15.00 | - | 18.00 | 15.00 | - | 18.00 | 16.00 | - | 18.00 | 17.00 | - | 18.00 | ||
| Shoulders— | ||||||||||||||||||||
| Skinned | 13.00 | - | 14.00 | 14.00 | - | 15.00 | 14.50 | - | 15.00 | 14.00 | - | 15.00 | 15.00 | - | 16.00 | 15.00 | - | 16.00 | ||
| Picnics— | ||||||||||||||||||||
| 4-6 lbs. average | 10.50 | - | 11.00 | 11.00 | - | 11.50 | 12.00 | - | 12.50 | ... | ... | ... | ||||||||
| 6-8 lbs. average | 10.00 | - | 10.50 | 10.00 | - | 11.00 | 11.00 | - | 12.00 | 11.00 | - | 12.00 | 11.00 | - | 12.00 | 13.00 | - | 14.00 | ||
| Butts— | ||||||||||||||||||||
| Boston style | 16.00 | - | 17.00 | 16.00 | - | 17.00 | 18.00 | - | 20.00 | 18.00 | - | 19.00 | 18.00 | - | 20.00 | 17.00 | - | 18.00 | ||
Fresh-meat trade during September was narrow and movements into consumptive channels were considerably less than during August, except for a short period at the beginning of the month when there was a fairly good demand for all classes. Although receipts of some classes were less than normal, week-end accumulations in wholesale markets were frequent and as a rule sharp declines followed.
Supplies of beef at eastern markets were approximately 8,250,000 lbs., or 13,800 carcasses less than a year ago. Veal supplies decreased 6,300 carcasses and mutton 32,000 carcasses. Lamb increased 63,000 carcasses, or 2,500,000 lbs. At eastern points the decrease in supplies of fresh pork from locally slaughtered hogs was more than offset by increased shipments from middle western packing centers and a net increase of 110,000 lbs. for the month was shown.
Beef.—Improved trade conditions which were expected to follow cooler weather did not materialize. Average weekly supplies were less than for several months past, but the demand was curtailed to an even greater extent. With liberal quantities of low-grade beef offered at packing centers, increased supplies of sausage material were available, and prices in most cases were fully 50% below those prevailing a year ago. Comparatively little choice beef was offered at any of the markets, and when it appeared in the form of heavy carcasses it was hard to move, selling only at a heavy discount. Carcasses weighing from 450 to 600 lbs. were the kind most in demand.
With supplies at eastern markets consisting chiefly of medium to good grass-fed steers, prices were uneven and during most of the month tended downward. Boston was relatively steadier than other eastern markets and closed only about $1 lower, while New York and Philadelphia registered sharp weekly fluctuations and closed unevenly $1 to $2 net lower. Although the demand at Chicago was again narrow and showed no apparent improvement over that of the preceding month, price changes were slight. To some extent this was caused by local conditions and the ability to adjust supplies to the demand.
Cow beef constituted a relatively small proportion of the offerings at all markets, and was materially less in quantity than at the same time a year ago. Markets were not generally supplied with bulls, and in most cases daily receipts were insufficient to justify quotations.
While kosher beef markets registered slight weekly fluctuations, the range of prices generally was steady, though somewhat higher than in August. The better grades were in best demand. Because of the near approach of Yom Kippur and other Jewish holidays, kosher killing was discontinued during the closing days of September and any surplus supplies were offered for sale to the regular trade.
Veal.—Liberal offerings of heavy veal carcasses, most of which were of undesirable quality, had a depressing effect on prices in general. Milk-fed veal was scarce, but when available found ready sale at firm prices. Receipts at eastern markets were 6,300 carcasses less than during the corresponding month a year ago, but were more than the trade required. Price ranges were materially widened, with the trend upward during the first week, but sharply downward through the remainder of the month. All markets were similarly affected. Closing prices at eastern markets were unevenly $2 to $3 lower than the opening, with common and medium grades registering the greatest decline. Choice veal at Chicago closed steady to $1 higher, with other grades mostly $2 lower than the opening.
Lamb.—With continued heavy receipts of lambs at live-stock centers, the dressed trade was in a chaotic condition. Although estimated receipts of lamb at seven of the principal live-stock markets showed a decrease of 12% as compared with the same month one year ago, liberal offerings of Canadian lambs at eastern markets more than offset the decrease and intensified the already existing unsettled condition. This, together with the continued unequal demand, assisted in pushing prices of the dressed product below the low point reached in February of the present year. Total supplies at eastern markets exceeded those of the same period a year ago by 2,500,000 lbs., and fluctuations on the different grades amounted to $6.
While Chicago registered smaller fluctuations the trend was steadily downward and closing prices were $2 to $3 below the opening. Although closing prices at eastern markets were slightly above the low spot for the month, trade conditions at the close were generally unsatisfactory to the selling side. At the beginning of the month cold storage holdings were 820,519 lbs. less than a month earlier, but were still considerably above the season’s average during prewar years.
Mutton.—Receipts of mutton at eastern markets decreased 32,000 carcasses as compared with the same period a year ago. This reduction, together with a general improvement in quality over that of the previous month, was the principal factor contributing to a generally steady market in the East, particularly during the last half of the month. With supplies at Chicago consisting largely of heavy bucks and ewes and practically no handyweight wethers, that market declined sharply and closed $1.50 to $2 below the opening.
Pork.—Conditions in the fresh-pork trade were generally unsettled. Sharp weekly fluctuations caused by erratic advances on Mondays, which could not be maintained through the week, were an outstanding feature of the month’s trade at some markets. Supplies of loins at eastern markets were practically the same as a year ago and consisted mostly of frozen or chilled stock, for which there was an uneven demand. The latter sold at a wide range of prices and unevenly $4 to $10 below corresponding averages of fresh loins. Closing prices at eastern markets were only slightly changed from the opening, some averages being 50¢ to $1 lower.
Conditions at Chicago, which has been the high market during the past two months, were materially changed and declines equaling the advances of late July were registered during the last half of September. From the high point of $32 on light average loins, prices had dropped to $26 at the close. Heavier average loins registered similar declines. Shoulder cuts were relatively more stable but were mostly $1 to $1.50 off at the close.
Cured pork and lard.—The domestic demand for cured pork cuts and lard, while fair for the season, was not of sufficient volume to offset the decline in live-stock markets and prices registered sharp declines. Dry salt meats and lard were in relatively better demand than hams, bacon, and picnics, and showed proportionately smaller declines. At the close wholesale prices of hams at Chicago were off $3 to $3.50, bacon $2 to $2.50, and picnics $1.50 to $2. The net decline on lard amounted to 75¢, dry salt backs 50¢ to 75¢, and dry salt bellies about $1. Reacting from the general upward trend of prices during August, compound lard markets were weak and closing prices were unevenly 75¢ to $1.50 under the opening.
STOCKER AND FEEDER SHIPMENTS.
Week ending Friday, Sept. 30.
| Cattle and calves. |
Hogs. | Sheep. | |
|---|---|---|---|
| Market origin: | |||
| Chicago | 11,838 | ... | 41,892 |
| East St. Louis | 6,799 | 551 | 1,289 |
| Fort Worth | 3,097 | 353 | 177 |
| Indianapolis | 1,675 | 537 | 262 |
| Kansas City | 26,728 | 2,428 | 10,674 |
| Oklahoma City | 2,504 | 272 | ... |
| Omaha | 21,578 | ... | 54,992 |
| St. Joseph | 3,611 | 145 | 8,148 |
| St. Paul | 9,745 | 204 | 3,837 |
| Sioux City | 11,497 | 2,223 | 5,651 |
| Wichita | 2,605 | 127 | ... |
| Total | 101,677 | 6,840 | 126,922 |
| Previous week | 93,564 | 5,770 | 80,524 |
| Same week last year | 109,142 | 8,795 | 168,815 |
| State destination: | |||
| Arkansas | 30 | 146 | ... |
| California | 364 | ... | ... |
| Georgia | 78 | ... | ... |
| Idaho | 2 | ... | ... |
| Illinois | 16,394 | 1,016 | 18,285 |
| Indiana | 5,966 | 537 | 13,297 |
| Iowa | 21,252 | 2,564 | 27,640 |
| Kansas | 6,823 | 538 | 1,482 |
| Kentucky | 715 | ... | 1,671 |
| Maryland | 162 | ... | 656 |
| Massachusetts | 24 | ... | ... |
| Michigan | 1,160 | ... | 9,696 |
| Minnesota | 1,899 | 642 | 3,931 |
| Missouri | 13,765 | 431 | 15,310 |
| Nebraska | 17,666 | 563 | 24,891 |
| New Jersey | 19 | ... | ... |
| New York | ... | ... | 884 |
| Ohio | 4,112 | 216 | 4,607 |
| Oklahoma | 3,571 | 126 | ... |
| Pennsylvania | 4,490 | ... | ... |
| South Dakota | 1,201 | ... | 1,877 |
| Tennessee | 26 | ... | ... |
| Texas | 1,190 | 61 | 177 |
| Virginia | 25 | ... | ... |
| West Virginia | 56 | ... | ... |
| Wisconsin | 687 | 1,866 | 2,518 |
| Total | 101,677 | 6,840 | 126,922 |
Iowa led all other States in the number of telephones on farms reported to the Census Bureau on Jan. 1. A total of 2,508,002 farms or 38.9% of all farms in the country, had telephones.
A list containing the names and addresses of 10,000 live-stock raisers and breeders has just been received from the Minister of Agriculture of Brazil. The list also gives the number of animals owned by each producer. The total number of animals represented is 5,227,113.
Of the 10,000 breeders, 1,092 have 1,000 to 5,000 animals; 107 have between 5,000 and 10,000; and 39 have more than 10,000. Three of this latter group have 34,000 animals and one has 85,000. This list has been classified according to the number of animals owned, made up in mimeographed form, and will be sent to interested parties upon request. The list does not show the breed or kind of live stock grown.
Similar lists of breeders in Uruguay, Argentina, Colombia, and Mexico are also available. The list of Uruguayan breeders includes only those who have pure-bred animals and does not give the number owned. They are classified according to the breed raised. The list of Argentine breeders consists of the exhibitors at the Palermo show.
The exports of frozen beef from Argentina during the first seven months of 1921 show a decrease of 3,154,275 quarters, compared with the exports during the corresponding months of 1920, according to statistics compiled by the Review of the River Plate. The exports of chilled beef during the same period increased 601,096 quarters; exports of frozen mutton and lamb increased 1,011,754 and 355,593 carcasses, respectively.
The United Kingdom furnished the chief market for all of the frozen and chilled meats exported from Argentina during the seven months’ period, taking 1,582,035 quarters of frozen beef, 772,162 quarters of chilled beef, 1,468,466 carcasses of frozen mutton, and 586,123 carcasses of frozen lamb.
The following table shows the exports of frozen and chilled beef and frozen mutton and lamb from Argentina for the first seven months of 1921 as compared with the same period in the five preceding years:
| First 7 months of— |
Frozen beef. |
Chilled beef. |
Frozen mutton. |
Frozen lamb. |
|---|---|---|---|---|
| Quarters. | Quarters. | Car- casses. |
Car- casses. |
|
| 1916 | 2,465,408 | 450,628 | 933,964 | 393,116 |
| 1917 | 2,935,365 | 373,083 | 664,540 | 314,435 |
| 1918 | 3,249,649 | 23,544 | 546,161 | 120,012 |
| 1919 | 2,851,533 | 74,598 | 826,958 | 131,826 |
| 1920 | 5,344,635 | 183,114 | 594,727 | 260,943 |
| 1921 | 2,189,360 | 784,210 | 1,606,481 | 616,536 |
CHICAGO WHOLESALE PRICES OF CURED
PORK AND PORK PRODUCTS.
[Per 100 lbs.]
| Sept. 30. | Sept. 23. | Sept. 2. | |||||||
|---|---|---|---|---|---|---|---|---|---|
| Hams, smoked, 14-16 average | $23.50 | - | 24.00 | $24.00 | - | 25.50 | $27.00 | - | 29.00 |
| Hams, fancy 14-16 average | 26.00 | - | 26.75 | 26.00 | - | 28.00 | 30.00 | - | 31.50 |
| Picnics, smoked, 4-8 average | 12.50 | - | 15.00 | 12.50 | - | 14.50 | 14.50 | - | 16.00 |
| Bacon, breakfast, 6-8 average | 23.50 | - | 24.50 | 24.00 | - | 24.50 | 25.00 | - | 27.00 |
| Bacon, fancy, 6-8 average | 34.00 | - | 35.00 | 33.00 | - | 35.50 | 34.00 | - | 38.00 |
| Bellies, D. S., 14-16 average | 14.75 | - | 10.00 | 13.75 | - | 15.75 | 15.00 | - | 15.50 |
| Backs, D. S., 14-16 average | 11.75 | - | 12.25 | 10.25 | - | 11.75 | 11.00 | - | 11.50 |
| Pure lard, tierces | 11.50 | - | 13.75 | 13.00 | - | 13.75 | 13.00 | - | 14.50 |
| Compound lard, tierces | 12.00 | - | 13.00 | 12.25 | - | 12.75 | 11.00 | - | 12.00 |
COLD STORAGE HOLDINGS OF FISH, SEPT. 15.
[Thousands of pounds, i. e., 000 omitted.]
| Varieties. | Sept. 15, 1921. |
Sept. 15, 1920. |
Aug. 15, 1921. |
Aug. 15, 1920. |
Frozen since Aug. 15, 1921. |
|---|---|---|---|---|---|
| FROZEN FISH. | |||||
| Bluefish | 442 | 256 | 282 | 211 | 180 |
| Butterfish | 422 | 615 | 255 | 489 | 203 |
| Ciscoes | 5,841 | 4,999 | 4,444 | 2,152 | 1,875 |
| Cod, bake, pollack | 1,865 | 2,578 | 1,878 | 2,113 | 95 |
| Croakers | 345 | 709 | 331 | 281 | 93 |
| Halibut | 9,125 | 10,340 | 7,693 | 8,630 | 1,363 |
| Herring | 3,870 | 5,405 | 3,715 | 5,480 | 632 |
| Lake trout | 1,043 | 555 | 991 | 554 | 93 |
| Mackerel | 1,603 | 2,678 | 1,696 | 3,015 | 105 |
| Rock fishes | 69 | 200 | 69 | 185 | 4 |
| Sablefish | 978 | 834 | 600 | 597 | 339 |
| Salmon, fall | 836 | 891 | 759 | 815 | 65 |
| Salmon, silver | 1,064 | 540 | 631 | 414 | 453 |
| Salmon,other | 5,262 | 3,248 | 3,419 | 2,281 | 1,664 |
| Sea bass | 61 | 109 | 68 | 122 | 4 |
| Shad | 349 | 502 | 325 | 474 | 28 |
| Shad roe | 43 | 43 | 45 | 49 | ... |
| Smelts, eulachon, etc. | 335 | 116 | 272 | 101 | 65 |
| Squid | 3,017 | 2,163 | 3,177 | 910 | 53 |
| Weakfish | 1,755 | 493 | 1,640 | 449 | 190 |
| Whitefish | 1,782 | 1,016 | 1,587 | 624 | 207 |
| Whiting | 5,258 | 9,649 | 4,974 | 8,630 | 464 |
| Miscellaneous | 9,226 | 8,453 | 8,580 | 8,565 | 1,181 |
| Total | 54,591 | 56,297 | 47,431 | 47,141 | 9,356 |
| CURED FISH. | |||||
| Herring | 16,207 | 22,752 | 11,913 | 22,111 | ... |
| Mild cured salmon | 6,855 | 8,275 | 6,165 | 8,149 | ... |
“It has been announced in the press that Quebec farmers are receiving a few dollars only for grass-fed calves, and from $10 up for cows, steers, etc.,” reports the American vice consul at Montreal. “The farmer sells his steer to the drover for 5¢ a lb. on the hoof. The latter sells to the abattoir for 6¢, and, after he has paid his overhead expenses, freight, shrinkage, etc., he makes an average of about $5 on each animal. The abattoir figures on a profit of about $6 on an average steer. There is little or no profit made on the forequarters, and for this the hind-quarters must compensate.”
ANIMALS SLAUGHTERED UNDER FEDERAL INSPECTION DURING AUGUST.
| Station. | Cattle. | Calves. | Sheep. | Goats. | Swine. |
|---|---|---|---|---|---|
| Chicago | 138,496 | 34,538 | 293,516 | ... | 433,823 |
| Fort Worth | 33,713 | 40,516 | 13,549 | 39 | 27,079 |
| Kansas City | 98,897 | 26,647 | 104,831 | 36 | 167,034 |
| National Stock Yards | 24,516 | 11,105 | 48,312 | 16 | 72,874 |
| Omaha | 61,634 | 4,573 | 184,687 | ... | 123,089 |
| St. Louis | 16,788 | 4,965 | 10,663 | ... | 104,840 |
| Sioux City | 16,637 | 1,137 | 10,883 | ... | 72,845 |
| South St. Joseph | 23,797 | 5,962 | 58,814 | 13 | 105,624 |
| South St. Paul | 19,426 | 21,513 | 33,177 | ... | 96,357 |
| All other establishments | 246,515 | 152,840 | 478,560 | 97 | 1,326,894 |
| Total: | |||||
| August, 1921 | 680,419 | 303,796 | 1,236,992 | 201 | 2,530,459 |
| August, 1920 | 685,763 | 332,349 | 1,041,580 | 1,750 | 2,190,821 |
| 8 months ending August, 1921 | 4,907,174 | 2,526,022 | 8,540,072 | 3,240 | 26,440,048 |
| 8 months ending August, 1920 | 5,413,781 | 2,835,457 | 6,862,931 | 28,826 | 26,239,384 |
Horses slaughtered at all establishments, 175; Inspections of lard prepared at all establishments, 126,026,473 lbs.; compound and other substitutes, 29,823,542 lbs. Corresponding inspections for August, 1920: Lard, 96,527,453 lbs.; compound and other substitutes, 28,322,618 lbs.

Potato prices declined during the week ending Oct. 3 under the heaviest movement of the season. Prices of cabbage and sweet potatoes were lower. Apple prices showed a weaker tone. Other lines were fairly steady. Total shipments of leading lines for the week were 24,033 cars, or about one-third more than during the preceding week. During the corresponding week last year 17,283 cars were moved. The heaviest week’s movement last season was during Oct. 12 to 18, with 27,171 cars.
Potatoes.—Potato shipments reached 10,001 cars during the week ending Oct. 1, thereby increasing the season’s total shipments to 80,560 cars as compared with 65,833 cars moved last year to the same date. The week’s shipments nearly doubled those of last week which were 5,824 cars. Minnesota, the heaviest contributing State, shipped 2,573 cars, North Dakota 1,656 cars, and Maine 1,010 cars. Markets were heavily supplied, demand was slow and prices declined, but strengthened at the close. New York Round Whites declined 25¢ to a close of $1.75 per 100 lbs. sacked f. o. b. shipping points and ranged 40¢ to 50¢ lower in Pittsburgh at $2 to $2.10. Bulk stock declined 25¢ to 50¢ in Philadelphia to a range of $1.75 to $2 the middle of the week, but recovered at the close and ruled $2.15, a net loss of 10¢ from last week’s price.
Northern Round Whites declined 70¢ in the Chicago carlot market, to a range of $1.65 to $1.85, but strengthened to a close of $1.90 to $2. In producing sections, prices declined 20¢ to 35¢ during the week, ranging $1.45 to $1.80, but closed stronger at $1.60 to $1.90 f. o. b. Idaho Rurals ruled 25¢ lower at $1.10 f. o. b. shipping points. Maine Irish Cobblers followed the general trend, showing a net loss at shipping points of 25¢ and closing at $1.11 to $1.21 per 100 lbs., bulk f. o. b. Green Mountains declined 10¢ to 20¢ and closed at $1.26 to $1.41. Cobblers declined 15¢ to 25¢ in consuming markets, bulk stock ranging $1.65 to $1.85 in New York and sacked stock $1.75 to $1.85 in Boston.
Sweet potatoes.—Sweet potato markets were well supplied, demand was slow to moderate and prices weakened. More than half the week’s supply in city markets was furnished by Virginia, now the leading shipping State. Yellow varieties from the Eastern Shore lost $1.25 in New York City, closing weak at $2.75 to $3 per bbl. This stock ranged $4 to $4.50 in Chicago and $4 to $4.25 in other markets. Tennessee Nancy Halls declined 10¢ to 30¢ in Chicago to a range of 90¢ to $1.15 per bushel hamper, but were firm in St. Louis at $1.15. New Jersey yellow varieties were about steady in New York at $1.50 to $1.60 per bushel hamper and in Pittsburgh at $2, but weakened slightly in Chicago to a range of $1.90 to $2.15.
Apples.—Apple markets were well supplied, demand was slow to moderate, and prices show some declines. New York Baldwins, A21⁄2, were steady at $6.50 to $7 per bbl. in New York, $7 to $7.50 in Philadelphia, and sold in Boston at $2.10 to $2.15 per bu. box. This stock closed 25¢ higher at $6.25 f. o. b. shipping points. New York Rhode Island Greenings declined 50¢, closing at $7.50 to $8.25 in Chicago, and at $8 to $9 in New York. Northwestern Extra Fancy Jonathans were firm early in the week in New York City at $4.75 to $5 per box, but declined to a close of $4 to $4.25. Total shipments of apples from all sections for the season were 17,288 cars, or slightly more than for last season to the same date. Boxed apple shipments were 3,568 cars, or nearly double last week’s movement and more than three times as heavy as for the same week a year ago. Washington with 1,864 cars exceeded last week’s entire boxed apple movement of 1,846 cars. Barreled apple shipments were 2,348 cars compared with 2,771 a year ago. New York, the heaviest shipping section, sent 1,301 cars.
Onions.—Demand for onions was slow and markets were dull in the East. Chicago held steady. Eastern yellow Globes No. 1 were firm in New York the middle of the week at $3.75 to $4 per 100 lbs. sacked, but declined later, reaching $3.25 to $3.50. Other markets were firm at $3.75 to $4. Middle western yellow stock strengthened in New York and Cincinnati, ranging $4 to $4.25, and declined 25¢ in Pittsburgh, clos- $3.75 to $4. California yellow and brown varieties were steady in Chicago at $4.25 to $4.50.
Cabbage.—Markets for cabbage were dull in producing sections, with slow demand and movement. New York Danish type stock declined $2, ranging $30 to $33 per ton bulk f. o. b.; domestic closed slightly higher than last week at $23 to $25. A decline of about $10 occurred in consuming markets. Domestic stock closed at $30 to $35 in New York and at $20 to $25 in Philadelphia. Northern Danish held steady in Chicago at $35 and at $40 in St. Louis. Cabbage shipments for the week were 682 cars, exceeding those for the same time last year, but showing a decrease from last week’s movement. New York shipped 197 cars, Wisconsin 177, and Colorado 154.
CARLOAD SHIPMENTS OF FRUITS AND VEGETABLES.
| Commodity. | Week of Sept. 25 to Oct. 1. |
September. | August. | July. | Season to Oct. 1. |
|||||
|---|---|---|---|---|---|---|---|---|---|---|
| 1921 | 1920 | 1921 | 1920 | 1921 | 1920 | 1921 | 1920 | 1921 | 1920 | |
| Apples: | ||||||||||
| Boxed | 3,568 | 1,109 | 6,188 | 2,048 | 1,005 | 846 | 368 | 278 | 8,277 | 3,440 |
| Barreled | 2,348 | 2,771 | 5,692 | 8,995 | 2,215 | 2,854 | 659 | 1,560 | 9,061 | 13,824 |
| Cabbage | 682 | 522 | 2,514 | 1,791 | 1,293 | 993 | 416 | 507 | 17,396 | 17,691 |
| Cantaloupes | 113 | 259 | 2,091 | 2,784 | 5,917 | 6,771 | 8,016 | 5,284 | 24,538 | 22,316 |
| Celery | 145 | 113 | 445 | 420 | 219 | 150 | 98 | 68 | 4,958 | 3,633 |
| Grapes | 4,316 | 3,466 | 15,496 | 12,001 | 2,810 | 4,647 | 363 | 366 | 19,332 | 17,652 |
| Lettuce | 300 | 132 | 1,280 | 832 | 1,113 | 934 | 1,377 | 980 | 16,453 | 11,847 |
| Onions | 730 | 932 | 3,074 | 3,674 | 1,816 | 1,899 | 1,403 | 1,031 | 11,758 | 13,344 |
| Peaches | 41 | 1,795 | 4,921 | 10,528 | 6,937 | 6,284 | 8,673 | 6,881 | 25,967 | 25,474 |
| Pears | 546 | 786 | 3,793 | 4,850 | 5,089 | 3,079 | 1,461 | 2,417 | 10,458 | 10,462 |
| Potatoes: | ||||||||||
| Sweet | 692 | 531 | 2,799 | 2,840 | 1,860 | 665 | 225 | 92 | 5,038 | 3,656 |
| White | 10,001 | 4,055 | 24,707 | 18,057 | 15,639 | 13,583 | 16,513 | 15,621 | 80,560 | 65,833 |
| Tomatoes | 387 | 692 | 2,468 | 3,434 | 995 | 1,604 | 1,644 | 2,180 | 15,074 | 13,652 |
| Watermelons | 91 | 92 | 1,788 | 2,174 | 11,435 | 10,299 | 19,206 | 20,199 | 44,172 | 39,109 |
| Vegetables (mixed) | 309 | 233 | 1,323 | 947 | 1,380 | 972 | 1,369 | 719 | 12,340 | 9,453 |
| Total | 24,269 | 17,488 | 78,579 | 75,375 | 59,723 | 55,580 | 61,791 | 58,183 | 305,382 | 271,386 |
PRICES OF FRUITS AND VEGETABLES.
Jobbing Range.
| POTATOES, Eastern and Northern Round-Whites, No. 1, per 100 lbs. sacked. |
||||||||||
| Market. | Car- loads re- ceived. |
This season. | One year ago. | |||||||
|---|---|---|---|---|---|---|---|---|---|---|
| Oct. 3 | Sept. 26. | |||||||||
| New York | 428 | [1]$1.65 | - | $1.80 | [1]$2.20 | - | $2.30 | [2]$1.70 | - | $1.80 |
| Boston | 270 | [1]1.75 | - | 1.85 | [1]2.00 | [1]1.75 | - | 1.85 | ||
| Philadelphia | 202 | [1]2.00 | - | 2.15 | 2.25 | 2.00 | ||||
| Pittsburgh | 178 | 2.00 | - | 2.10 | 2.50 | 2.50 | - | 2.65 | ||
| Cincinnati | 69 | 2.35 | 2.50 | - | 2.65 | 2.35 | ||||
| Chicago | 701 | [3]1.90 | - | 2.00 | [3]2.35 | - | 2.50 | [3]2.00 | - | 2.25 |
| St. Louis | 99 | [4]2.25 | - | 2.30 | [4]2.50 | - | 2.65 | 2.30 | - | 2.40 |
| Kansas City | 217 | [4]2.00 | - | 2.10 | [4]2.30 | [4]1.75 | - | 2.00 | ||
| SWEET POTATOES, Virginia Eastern Shore Yellow Varieties, Barrels. |
||||||||||
| New York | 109 | $2.75 | - | $3.00 | $3.50 | - | $4.00 | $3.75 | - | $4.25 |
| Boston | 32 | 4.00 | - | 4.25 | 4.00 | - | 4.25 | 4.25 | - | 4.50 |
| Philadelphia | 1 | 4.00 | 3.25 | ... | ||||||
| Pittsburgh | 28 | 4.00 | - | 4.15 | 4.00 | 4.25 | - | 4.50 | ||
| Cincinnati | 11 | 4.00 | - | 4.25 | 4.25 | - | 4.50 | 4.00 | - | 4.25 |
| Chicago | 41 | 4.00 | - | 4.50 | 4.50 | - | 4.75 | 4.25 | - | 4.75 |
| St. Louis | 1 | [5]1.15 | [5]1.10 | - | 1.15 | [5]1.25 | ||||
| Kansas City | ... | [5]1.00 | - | 1.10 | [5]1.15 | - | 1.25 | ... | ||
| ONIONS, Eastern and Middle Western Yellow Globes, No. 1, per 100 lbs. sacked. |
||||||||||
| New York | 99 | $3.25 | - | $3.50 | $3.50 | - | $3.75 | $1.75 | - | $1.90 |
| Boston | 30 | 3.75 | 3.50 | - | 3.75 | 1.50 | - | 1.60 | ||
| Philadelphia | 30 | 4.00 | 3.25 | - | 4.00 | 1.25 | - | 1.60 | ||
| Pittsburgh | 40 | 3.75 | - | 4.00 | 3.75 | - | 4.25 | 1.50 | - | 1.75 |
| Cincinnati | 9 | 4.25 | 3.75 | - | 4.25 | 1.50 | ||||
| Chicago | 90 | 3.75 | - | 4.00 | 3.50 | - | 3.75 | 1.75 | - | 1.90 |
| St. Louis | 29 | [6]3.50 | - | 3.75 | [6]3.75 | [6]1.85 | - | 2.00 | ||
| Kansas City | 30 | [6]3.00 | - | 3.25 | [6]2.25 | [6]1.75 | ||||
| CABBAGE, New York and Northern Domestic, per Ton Bulk. |
||||||||||
| New York | 29 | $30 | - | $35 | $40 | ... | ||||
| Philadelphia | 26 | 15 | - | 20 | $30 | - | 35 | $10 | - | $13 |
| Pittsburgh | 12 | [7]2.00 | - | 2.25 | [7]2.00 | - | 2.25 | 20 | ||
| Cincinnati | 10 | 24 | - | 25 | 35 | - | 40 | 18 | - | 20 |
| Chicago | 38 | [8]35 | 24 | - | 25 | 8 | - | 9 | ||
| St. Louis | 57 | [8]40 | 35 | - | 40 | 30 | - | 35 | ||
| Kansas City | 48 | [7]1.75 | [7]2.25 | [7]1.50 | ||||||
| APPLES, New York and Maine Baldwins and Fall Varieties, A21⁄2, Barrels. |
||||||||||
| New York | 408 | $6.50 | - | $7.00 | $8.00 | - | $12.00 | $5.00 | - | $5.50 |
| Boston | 121 | 8.00 | - | 9.00 | 6.00 | - | 10.00 | 4.00 | ||
| Philadelphia | 118 | 7.00 | - | 7.50 | 8.00 | - | 10.50 | 4.50 | ||
| Pittsburgh | 92 | 8.00 | - | 8.50 | 7.00 | 4.00 | - | 4.50 | ||
| Cincinnati | 100 | 8.00 | - | 8.50 | 8.00 | - | 8.50 | ... | ||
| Chicago | 403 | 8.25 | - | 9.00 | 8.00 | - | 8.50 | 5.50 | - | 6.00 |
| Kansas City | 99 | ... | ... | [9]7.00 | - | 8.00 | ||||
| Prices f. o. b. Shipping Points. | ||||||||||
| POTATOES (100 lbs. sacked). |
||||||||||
| Rochester, N. Y. | $1.75 | $2.00 | ... | |||||||
| Presque Isle, Me. | [7]$1.26 | - | 1.41 | [7]1.46 | - | 1.52 | [7]$1.30 | - | $1.35 | |
| Grand Rapids, Mich. | 1.75 | - | 1.80 | 1.95 | - | 2.10 | 2.00 | |||
| Waupaca, Wis. | 1.60 | - | 1.90 | 1.95 | 1.80 | - | 1.85 | |||
| Minneapolis, Minn. | 1.65 | - | 1.85 | 1.70 | - | 1.95 | 1.75 | - | 1.90 | |
| Alliance, Nebr. | 1.80 | 1.70 | - | 1.95 | 1.50 | |||||
| Idaho Falls, Idaho | 1.10 | 1.35 | [10]1.10 | - | 1.15 | |||||
| Greeley, Colo. | [10]1.15 | - | 1.25 | [10]1.40 | [10]1.10 | - | 1.15 | |||
| CABBAGE (ton bulk). |
||||||||||
| Rochester, N. Y. | 30.00 | 32.00 | - | 35.00 | 10.00 | |||||
| ONIONS (100 lbs. sacked). |
||||||||||
| Massachusetts Points | 3.50 | 3.50 | - | 3.75 | 1.40 | - | 1.60 | |||
| APPLES. | ||||||||||
| Barreled: | ||||||||||
| Rochester, N. Y. | 6.25 | 6.00 | 3.50 | - | 4.00 | |||||
| Boxed: | ||||||||||
| Spokane, Wash. | 2.00 | - | 2.15 | 2.25 | 2.00 | - | 2.35 | |||
[1] Maine Irish Cobblers.
[2] Maine Irish Cobblers, bulk 100 lbs.
[3] Carlot sales.
[4] Minnesota Red River Ohios.
[5] Tennessee Nancy Halls.
[6] Red varieties.
[7] Bulk 100 lbs.
[8] Danish type.
[9] Missouri Jonathans.
[10] Wagonloads, cash to growers.
New York and Michigan Concord grapes in 12-qt. climax baskets declined 10¢ to 25¢ in New York and Boston, ranging 75¢ to $1.10, and closed lower in Chicago at $1 to $1.25. Niagaras were weak in New York at 75¢ to 85¢. New York cauliflower was slow and dull in Philadelphia at $1.75 per crate, and ranged $2 to $2.25 in other markets. Michigan Golden Heart celery in highball crates was slow and steady in Chicago and St. Louis at $1 to $1.25 and ranged $1.75 to $2 in Pittsburgh. Massachusetts cranberries were steady in Boston at $5 to $6 per 1⁄2-barrel crate, and at $6.25 to $6.50 in Pittsburgh and Cleveland. New York Bartlett pears ranged $3.25 to $3.50 per bushel basket in leading markets.
The potato crop in Aroostook Co., Me., promises to be the largest ever produced in northern Maine. Early plantings were damaged somewhat by dry weather, but the later plantings have developed fully, and the stock has become overgrown in many cases. The yield of Irish Cobblers will average 120 to 150 bbls. to the acre, with some yields as high as 200 bbls.
With a probable demand from a wide territory there is much local confidence in the outcome of the marketing season, especially after the first of the year. During the rise in the market the first week of September large quantities of potatoes were sold on a basis of $3 per bbl. to the grower, but many of these shipments were marketed at a loss. Large quantities of potatoes are being stored because of the generally low price level. Much of the stock that is being sold is that for which storage space can not be obtained or which must be sold for financial reasons. The growers generally feel that they should have $1.75 per 100 lbs. bulk.
The first heavy frost of the season came Sept. 21, and digging of all varieties will be pushed from now on. Shipments will continue moderately heavy and would undoubtedly become very heavy with stronger market conditions.
Top price of the season in New York was $1,150 per car. The general range in June in New York was $450 to $900 and in July $250 to $550. No sales of medium sizes were reported in Philadelphia above $900 and prevailing ranges during June were $400 to $700, but declines to a range of $250 to $500 occurred in July. Sales in Boston ranged nearly as high as in New York, allowing 1,000 melons per carload. Early quotations in Boston ranged 60¢ to $1.10 per melon, but price declined in July to a range of 30 to 65¢. Pittsburgh carlot sales ranged $500 to $1,025 in May and June and $250 to $500 in July. Chicago market quoted a top of $1,100 the last of May, but prevailing early ranges were $500 to $800 and July sales $200 to $600.
In the table “Carlot shipments of cantaloupes” on page 217 of the The Market Reporter for Oct. 1. the last column should be headed “To Sept. 17, 1920,” and the next to last column headed “To Sept. 17, 1921.”
Shipments of watermelons by the end of September somewhat exceeded 44,000 cars. The movement had surpassed that of last year by nearly 5,000 cars and was much larger than that of any preceding year.
The great Florida-Georgia-South Carolina melon section has shipped about 25,000 cars. Three other States, Texas, California, and Missouri, shipped 3,000 to 5,000 cars each; Alabama and North Carolina shipped over 1,000 each; Arkansas, Indiana, Oklahoma, 400 to 700 each; and 14 other States in smaller amounts. The season’s movement not only has exceeded the previous record-breaking volume of 1920 but is one-half greater than that of 1919 or of 1917 and more than double that of 1918.
Production the past three years has tended to increase rapidly in nearly all the leading watermelon States. Nearly 30,000 acres were planted in Texas compared with 38,000 in Georgia, the leading State, but shipments from Texas were greatly reduced by unfavorable weather. In most other sections conditions were favorable. Taking the watermelon section as a whole, there was a greater production from an acreage about the same as in 1920.
The East has been aggressively increasing its hold on the commercial production of watermelons during the past few seasons. Of the 5,000 cars constituting this season’s excess of shipments as compared with the movement last year, 3,000 cars came from the Southeast, about 1,000 cars from the Middle West, and a few hundred cars from the Far West.
The 1921 crop for the most part was of excellent grade. The size of Florida melons was reduced by drought, but conditions improved as the growing season moved northward.
The 1921 season opened with prices as high as in any preceding season. First sales in May exceeded $1,000 per car for medium sizes in New York, Chicago, and Pittsburgh. Similar prices were reported at the opening of the 1920 season and there were a few opening sales of medium size melons around $1,000 in 1919. In 1918 ranges in the early part of the season were only about one-half those of 1919 and were still lower in 1917 and 1916.
Prices in 1921 were not so well sustained as in 1920. During July heavy shipments from Georgia depressed the markets rapidly. July opened with carlot sales at $250 to $650 in city markets, but the range soon declined, reaching $200 to $250. The first week of August prices reached the low point of the season at $150 to $250 per car but recovered about $25 toward the end of the season of heavy shipments.
Prices opened at $300 to $515 f. o. b. Florida shipping points with top of $625, but declined rapidly with the beginning of the Georgia shipping season. Florida and Georgia Tom Watsons ranged $200 to $650 in July. Carolina melons at times ranged slightly lower than Georgia stock.
Prices of Missouri watermelons ranged $100 to $200 per car the first week of August, $125 to $250 the second week, and $120 to $200 the third week. Texas melons sold early in July at $2.50 to $3 per 100 lbs. but ranged mostly $1.25 to $1.75 in August. Further details of the price ranges of the principal lines of watermelons are given in the accompanying tables.
Carlot Shipments of Watermelons.
| To Sept. 24. |
Total season. |
|||||
|---|---|---|---|---|---|---|
| 1921 | 1920 | 1917 | 1918 | 1919 | 1920 | |
| Alabama | 1,398 | 1,160 | 1,634 | 806 | 708 | 1,160 |
| Arkansas | 520 | 314 | 449 | 93 | 268 | 314 |
| California | 3,455 | 3,106 | 1,137 | 1,689 | 3,300 | 3,272 |
| Delaware | 496 | 177 | 511 | 303 | 327 | 177 |
| Florida | 5,457 | 6,807 | 3,622 | 2,179 | 3,878 | 6,807 |
| Georgia | 15,791 | 11,103 | 9,530 | 6,782 | 8,984 | 11,103 |
| Illinois | 309 | 247 | 386 | 68 | 190 | 251 |
| Indiana | 706 | 647 | 630 | 191 | 581 | 661 |
| Iowa | 681 | 330 | 238 | 132 | 321 | 348 |
| Maryland | 759 | 458 | 1,019 | 388 | 515 | 458 |
| Missouri | 3,089 | 3,008 | 2,533 | 1,196 | 3,516 | 3,012 |
| North Carolina | 1,219 | 799 | 1,201 | 727 | 891 | 799 |
| Oklahoma | 549 | 464 | 505 | 189 | 870 | 465 |
| South Carolina | 4,407 | 4,735 | 4,107 | 2,787 | 2,673 | 4,735 |
| Texas | 4,056 | 4,839 | 2,871 | 2,290 | 3,007 | 4,845 |
| Virginia | 338 | 312 | 728 | 244 | 263 | 312 |
| Other States | 851 | 506 | 402 | 328 | 568 | 530 |
| Total | 44,081 | 39,012 | 31,503 | 20,392 | 30,860 | 39,249 |
RANGES OF WATERMELON PRICES
F. O. B. Shipping Points.
[Bulk per car.]
| State and year. |
Weights quoted. |
Opening. | High. | Low. | ||||||||||||||
|---|---|---|---|---|---|---|---|---|---|---|---|---|---|---|---|---|---|---|
| Week ending— |
Price. | Week ending— |
Price. | Week ending— |
Price. | |||||||||||||
| Florida: | Pounds. | |||||||||||||||||
| 1921 | 22 | - | 28 | May | 23 | $350 | - | $600 | May | 23 | $350 | - | $600 | July | 11 | $200 | - | $250 |
| 1920 | 22 | - | 28 | June | 14 | 250 | - | 500 | June | 14 | 250 | - | 500 | June | 28 | 175 | - | 500 |
| 1919 | 22 | - | 28 | June | 9 | 400 | - | 550 | June | 9 | 400 | - | 550 | June | 23 | 300 | - | 475 |
| 1918 | 20 | - | 25 | June | 3 | 300 | - | 400 | June | 24 | 350 | - | 450 | June | 10 | 275 | - | 400 |
| 1917 | 20 | - | 25 | June | 11 | 140 | - | 200 | June | 18 | 165 | - | 225 | June | 11 | 140 | - | 200 |
| Georgia: | ||||||||||||||||||
| 1921 | 22 | - | 28 | June | 27 | 200 | - | 525 | June | 27 | 200 | - | 525 | Aug. | 8 | 40 | - | 125 |
| 1920 | 22 | - | 28 | July | 5 | 200 | - | 450 | July | 5 | 200 | - | 450 | July | 19 | 75 | - | 200 |
| 1919 | 22 | - | 27 | June | 30 | 250 | - | 450 | June | 30 | 250 | - | 450 | July | 28 | 125 | - | 250 |
| 1918 | 28 | - | 30 | July | 1 | 135 | - | 175 | July | 8 | 200 | - | 220 | July | 15 | 75 | - | 150 |
| 1917 | 20 | - | 25 | June | 25 | 175 | - | 265 | July | 2 | 175 | - | 275 | Aug. | 20 | 70 | - | 75 |
| Texas: | ||||||||||||||||||
| 1921 | 22 | - | 28 | July | 18 | 80 | - | 250 | July | 18 | 80 | - | 250 | Aug. | 1 | [1]25 | - | 50¢ |
| 1920 | 22 | - | 28 | July | 5 | 250 | - | 375 | July | 12 | 150 | - | 375 | July | 19 | 65 | - | 250 |
| 1919 | 22 | - | 28 | July | 21 | 250 | - | 400 | July | 21 | 250 | - | 400 | July | 28 | 150 | - | 300 |
| 1918 | 20 | - | 27 | June | 24 | 335 | - | 400 | June | 24 | 335 | - | 400 | July | 22 | 100 | - | 200 |
| 1917 | 20 | - | 25 | July | 2 | 200 | - | 290 | July | 2 | 200 | - | 290 | July | 16 | 100 | - | 200 |
| Missouri: | ||||||||||||||||||
| 1921 | 22 | - | 28 | Aug. | 1 | 165 | - | 340 | Aug. | 1 | 165 | - | 340 | Aug. | 22 | 65 | - | 150 |
| 1920 | 22 | - | 28 | Aug. | 2 | 200 | - | 325 | Aug. | 9 | 300 | - | 425 | Aug. | 16 | 200 | - | 350 |
| 1919 | 22 | - | 28 | Aug. | 4 | 250 | - | 450 | Aug. | 4 | 250 | - | 450 | Aug. | 11 | 125 | - | 300 |
| 1918 | 20 | - | 25 | Aug. | 5 | 230 | - | 300 | Aug. | 12 | 300 | - | 400 | Aug. | 5 | 230 | - | 300 |
| 1916 | 22 | - | 27 | Aug. | 7 | 135 | - | 200 | Aug. | 14 | 110 | - | 175 | Aug. | 21 | 65 | - | 165 |
[1] Bulk per 100 lbs.
Sales to Jobbers in Leading Consuming Markets.
| State and variety. |
Year. | Weights quoted. |
Opening. | High. | Low. | ||||||||||||||
|---|---|---|---|---|---|---|---|---|---|---|---|---|---|---|---|---|---|---|---|
| Week ending— |
Price. | Week ending— |
Price. | Week ending— |
Price. | ||||||||||||||
| Pounds. | |||||||||||||||||||
| Florida, Tom Watsons | 1921 | 22 | - | 28 | May | 23 | $1,150 | May | 30 | $600 | - | 1,200 | July | 25 | 250 | - | 450 | ||
| 1920 | 22 | - | 28 | June | 14 | 500 | - | 1,100 | June | 14 | 500 | - | 1,100 | July | 12 | 300 | - | 500 | |
| 1919 | 23 | - | 28 | June | 9 | 750 | - | 1,050 | June | 9 | 750 | - | 1,050 | July | 14 | 300 | - | 550 | |
| 1918 | 20 | - | 25 | June | 3 | 300 | - | 500 | June | 24 | 550 | - | 800 | July | 8 | 300 | |||
| 1917 | 20 | - | 25 | June | 11 | 250 | - | 350 | July | 2 | 300 | - | 450 | July | 10 | 150 | - | 225 | |
| 1916 | 22 | - | 27 | Juno | 12 | 300 | - | 350 | June | 19 | 300 | - | 375 | July | 17 | 100 | - | 225 | |
| Georgia, Tom Watsons | 1921 | 22 | - | 28 | July | 11 | 250 | - | 650 | July | 11 | 250 | - | 650 | Aug. | 8 | 150 | - | 275 |
| 1920 | 22 | - | 28 | July | 12 | 400 | - | 750 | July | 12 | 400 | - | 750 | July | 19 | 250 | - | 600 | |
| 1919 | 23 | - | 28 | July | 7 | 350 | - | 800 | July | 7 | 350 | - | 800 | July | 21 | 150 | - | 350 | |
| 1918 | 28 | - | 30 | June | 24 | 550 | - | 800 | June | 24 | 550 | - | 800 | July | 22 | 250 | - | 350 | |
| 1917 | 20 | - | 25 | June | 25 | 275 | - | 450 | July | 2 | 300 | - | 450 | July | 30 | 150 | - | 225 | |
| 1916 | 22 | - | 27 | June | 19 | 300 | - | 380 | June | 19 | 300 | - | 380 | July | 10 | 150 | - | 225 | |
| Texas, Tom Watsons | 1921 | 22 | - | 28 | July | 11 | 250 | - | 300 | July | 25 | 275 | - | 375 | Aug. | 8 | [1]1.25 | - | 1.50 |
| 1920 | 22 | - | 28 | July | 12 | 250 | - | 400 | July | 12 | 250 | - | 400 | July | 19 | 250 | - | 400 | |
| 1919 | 23 | - | 28 | Aug. | 4 | 410 | - | 600 | Aug. | 4 | 410 | - | 600 | Aug. | 18 | 200 | - | 300 | |
| 1918 | 20 | - | 27 | July | 22 | [1]2.25 | - | 2.50 | July | 29 | [1]2.25 | - | 2.75 | July | 29 | [1]2.25 | - | 2.75 | |
| 1917 | 20 | - | 25 | July | 2 | 300 | - | 450 | July | 2 | 300 | - | 450 | Aug. | 20 | 200 | - | 275 | |
| 1916 | 20 | - | 27 | July | 17 | 175 | - | 250 | July | 31 | 200 | - | 275 | Aug. | 14 | 175 | - | 210 | |
| South Carolina | 1921 | 22 | - | 28 | July | 18 | 250 | - | 450 | July | 25 | 250 | - | 500 | Aug. | 15 | 100 | - | 225 |
| 1920 | 22 | - | 28 | July | 12 | 400 | - | 650 | July | 12 | 400 | - | 650 | July | 19 | 250 | - | 575 | |
| 1919 | 22 | - | 28 | July | 21 | 150 | - | 350 | Aug. | 4 | 300 | - | 600 | July | 21 | 150 | - | 350 | |
| 1918 | 20 | - | 25 | July | 29 | 225 | - | 450 | Aug. | 5 | 325 | - | 550 | July | 29 | 225 | - | 450 | |
| 1917 | 20 | - | 25 | July | 16 | 150 | - | 260 | Aug. | 13 | 225 | - | 350 | July | 23 | 150 | - | 190 | |
| 1916 | 22 | - | 27 | July | 3 | 175 | - | 250 | Aug. | 14 | 225 | - | 300 | July | 10 | 150 | - | 225 | |
| Missouri | 1921 | 22 | - | 28 | Aug. | 8 | 100 | - | 300 | Aug. | 8 | 100 | - | 300 | ... | ... | |||
| 1919 | 22 | - | 28 | Aug. | 4 | 325 | - | 450 | Aug. | 4 | 325 | - | 450 | Sept. | 1 | 150 | - | 300 | |
| 1918 | 20 | - | 25 | Aug. | 12 | 250 | - | 525 | Aug. | 19 | 500 | - | 515 | Aug. | 12 | 250 | - | 525 | |
| 1917 | 20 | - | 25 | Aug. | 13 | 150 | - | 275 | Aug. | 13 | 150 | - | 275 | Aug. | 20 | 175 | - | 200 | |
| 1916 | 22 | - | 27 | July | 31 | 200 | - | 275 | July | 31 | 200 | - | 275 | Aug. | 21 | 100 | - | 200 | |
[1] Bulk per 100 lbs.
CARLOAD SHIPMENTS OF FRUITS AND VEGETABLES IN SEPTEMBER.
| Shipping districts. | Septem- ber. |
Au- gust, 1921 |
Season to Oct. 1. |
Total last sea- son. |
||
|---|---|---|---|---|---|---|
| 1921 | 1920 | 1921 | 1920 | |||
| APPLES (boxed) | ||||||
| California | 1,179 | 967 | 668 | 2,207 | 1,980 | 4,495 |
| Colorado | 708 | 183 | 10 | 791 | 224 | 2,848 |
| Idaho | 1,093 | 102 | 22 | 1,238 | 137 | 2,789 |
| Montana | 96 | 22 | 11 | 117 | 26 | 429 |
| New Mexico | 344 | 57 | 141 | 490 | 69 | 278 |
| Oregon | 262 | 36 | 11 | 292 | 49 | 3,687 |
| Utah | 166 | 28 | 1 | 180 | 35 | 619 |
| Washington | 2,340 | 653 | 141 | 2,962 | 940 | 21,547 |
| Total | 6,188 | 2,048 | 1,005 | 8,277 | 3,410 | 36,092 |
| APPLES (barreled) | ||||||
| Delaware | 33 | 46 | 2 | 121 | 610 | 751 |
| Georgia | 27 | 11 | 15 | 52 | 41 | 159 |
| Illinois | 85 | 789 | 45 | 186 | 1,550 | 3,408 |
| Indiana | 18 | 61 | 0 | 21 | 92 | 290 |
| Kansas | 46 | 121 | 6 | 57 | 144 | 738 |
| Maine | 206 | 6 | 3 | 235 | 6 | 412 |
| Md., Eastern Shore | 35 | 31 | 2 | 43 | 109 | 139 |
| Md., other | 41 | 231 | 4 | 51 | 341 | 1,398 |
| Michigan | 1,356 | 1,188 | 1,085 | 2,851 | 2,401 | 6,122 |
| Minnesota | 11 | 32 | 12 | 23 | 32 | 41 |
| New Jersey | 25 | 126 | 40 | 157 | 524 | 846 |
| New York | 2,951 | 2,488 | 956 | 4,294 | 3,286 | 33,755 |
| Ohio | 158 | 43 | 3 | 179 | 70 | 966 |
| Pennsylvania | 59 | 190 | 0 | 63 | 265 | 3,412 |
| Vermont | 18 | 9 | 0 | 21 | 9 | 133 |
| Virginia | 118 | 1,523 | 2 | 127 | 1,738 | 8,324 |
| West Virginia | 392 | 744 | 18 | 433 | 902 | 4,785 |
| Wisconsin | 73 | 25 | 10 | 86 | 32 | 67 |
| Other sections | 40 | 1,331 | 12 | 61 | 1,672 | 6,203 |
| Total | 5,692 | 8,995 | 2,215 | 9,061 | 13,824 | 71,949 |
| CABBAGE. | ||||||
| Colorado | 740 | 262 | 698 | 1,578 | 696 | 1,671 |
| Illinois | 11 | 26 | 14 | 73 | 63 | 147 |
| Michigan | 168 | 66 | 8 | 183 | 71 | 362 |
| Minnesota | 117 | 171 | 30 | 163 | 221 | 808 |
| New York | 721 | 292 | 137 | 897 | 327 | 8,198 |
| Ohio | 33 | 24 | 6 | 246 | 93 | 343 |
| Va. Roanoke Sect. | 267 | 407 | 315 | 652 | 843 | 972 |
| Wisconsin | 422 | 404 | 15 | 471 | 443 | 4,894 |
| Other sections | 35 | 139 | 70 | 13,133 | 14,934 | 15,583 |
| Total | 2,514 | 1,791 | 1,293 | 17,396 | 17,691 | 32,978 |
| CANTALOUPES. | ||||||
| Calif., Turlock | 179 | 152 | 1,242 | 2,137 | 3,823 | 3,850 |
| Calif., other | 9 | 13 | 55 | 206 | 227 | 235 |
| Colorado | 1,790 | 2,088 | 1,248 | 3,086 | 2,369 | 2,454 |
| Michigan | 15 | 122 | 117 | 144 | 203 | 209 |
| Washington | 59 | 187 | 146 | 205 | 325 | 329 |
| Other sections | 39 | 222 | 2,771 | 18,780 | 15,369 | 15,380 |
| Total | 2,091 | 2,784 | 5,917 | 24,538 | 22,316 | 22,457 |
| CELERY. | ||||||
| Colorado | 39 | 85 | 10 | 53 | 108 | 296 |
| Michigan | 129 | 121 | 99 | 309 | 223 | 603 |
| New Jersey | 59 | 26 | 43 | 119 | 68 | 107 |
| New York | 107 | 105 | 6 | 128 | 127 | 2,783 |
| Ohio | 16 | 4 | 18 | 35 | 5 | 37 |
| Pennsylvania | 92 | 79 | 40 | 136 | 110 | 175 |
| Other sections | 3 | 0 | 3 | 4,178 | 2,992 | 6,356 |
| Total | 445 | 420 | 219 | 4,958 | 3,633 | 10,357 |
| GRAPES. | ||||||
| Calif., N. dist. | 5,449 | 4,610 | 268 | 5,984 | 5,709 | 11,605 |
| Calif., C. dist. | 6,533 | 3,818 | 2,181 | 9,054 | 7,388 | 12,862 |
| Calif., S. dist. | 1,046 | 1,434 | 129 | 1,412 | 2,111 | 2,454 |
| Michigan | 947 | 1,428 | 114 | 1,083 | 1,603 | 4,597 |
| New York | 1,240 | 539 | 71 | 1,440 | 601 | 6,084 |
| Pennsylvania | 183 | 1 | 0 | 207 | 1 | 1,235 |
| Washington | 61 | 6 | 1 | 64 | 5 | 7 |
| Other sections | 37 | 165 | 46 | 88 | 234 | 292 |
| Total | 15,496 | 12,001 | 2,810 | 19,332 | 17,652 | 39,136 |
| LETTUCE. | ||||||
| California | 139 | 52 | 148 | 8,386 | 5,313 | 5,313 |
| Colorado | 102 | 80 | 108 | 214 | 116 | 124 |
| Minnesota | 12 | 18 | 12 | 39 | 40 | 51 |
| New York | 824 | 568 | 702 | 2,721 | 2,008 | 2,146 |
| Oregon | 18 | 5 | 5 | 23 | 5 | 5 |
| Washington | 168 | 93 | 129 | 547 | 313 | 344 |
| Other sections | 17 | 16 | 9 | 4,523 | 4,052 | 4,498 |
| Total | 1,280 | 832 | 1,113 | 16,453 | 11,847 | 12,481 |
| PEACHES. | ||||||
| California | 1,581 | 1,624 | 3,877 | 6,810 | 7,350 | 7,354 |
| Colorado | 573 | 708 | 554 | 1,218 | 771 | 773 |
| Idaho | 93 | 31 | 10 | 103 | 32 | 33 |
| Michigan | 65 | 2,122 | 120 | 185 | 2,154 | 2,275 |
| New York | 1,169 | 3,442 | 1,650 | 2,819 | 3,572 | 4,697 |
| Oregon | 34 | 1 | 16 | 50 | 1 | 1 |
| Utah | 616 | 402 | 207 | 820 | 374 | 401 |
| Washington | 750 | 188 | 353 | 1,107 | 203 | 201 |
| Other sections | 40 | 2,010 | 150 | 12,855 | 11,017 | 11,258 |
| Total | 4,921 | 10,528 | 6,937 | 25,967 | 25,474 | 26,996 |
| ONIONS. | ||||||
| California | 700 | 753 | 315 | 1,993 | 2,810 | 4,403 |
| Colorado | 70 | 5 | 0 | 74 | 7 | 144 |
| Idaho | 20 | 1 | 0 | 21 | 1 | 30 |
| Illinois | 63 | 33 | 41 | 118 | 66 | 357 |
| Indiana | 480 | 669 | 177 | 671 | 776 | 3,444 |
| Iowa | 69 | 224 | 99 | 245 | 525 | 865 |
| Massachusetts | 571 | 619 | 194 | 894 | 815 | 3,834 |
| Michigan | 92 | 77 | 7 | 100 | 84 | 744 |
| Minnesota | 53 | 25 | 1 | 60 | 25 | 276 |
| New Jersey | 37 | 71 | 31 | 407 | 606 | 634 |
| New York | 509 | 395 | 540 | 1,140 | 470 | 3,037 |
| Ohio | 235 | 546 | 70 | 325 | 592 | 3,040 |
| Oregon | 64 | 1 | 1 | 67 | 2 | 17 |
| Utah | 23 | 0 | 0 | 25 | 0 | 7 |
| Washington | 35 | 95 | 229 | 493 | 722 | 783 |
| Wisconsin | 29 | 45 | 0 | 29 | 49 | 400 |
| Other sections | 24 | 115 | 111 | 5,096 | 5,794 | 6,108 |
| Total | 3,074 | 3,674 | 1,816 | 11,758 | 13,344 | 28,123 |
| SWEET POTATOES. | ||||||
| Alabama | 25 | 48 | 199 | 380 | 247 | 483 |
| California | 196 | 123 | 50 | 254 | 193 | 695 |
| Delaware | 16 | 6 | 0 | 16 | 6 | 1,802 |
| Georgia | 31 | 53 | 22 | 56 | 80 | 899 |
| Iowa | 23 | 7 | 0 | 23 | 7 | 16 |
| Louisiana | 47 | 29 | 56 | 117 | 65 | 632 |
| Maryland | 159 | 216 | 62 | 236 | 228 | 1,626 |
| New Jersey | 383 | 329 | 74 | 484 | 349 | 3,092 |
| North Carolina | 57 | 180 | 389 | 498 | 485 | 861 |
| Oklahoma | 22 | 6 | 0 | 23 | 6 | 75 |
| Tennessee | 119 | 53 | 36 | 163 | 78 | 882 |
| Texas | 89 | 61 | 46 | 147 | 106 | 604 |
| Va., Norfolk | 34 | 85 | 152 | 191 | 104 | 635 |
| Va., Eastern Shore | 1,572 | 1,630 | 713 | 2,353 | 1,661 | 4,872 |
| Other sections | 26 | 14 | 61 | 97 | 41 | 793 |
| Total | 2,799 | 2,840 | 1,860 | 5,038 | 3,656 | 17,967 |
| WATERMELONS. | ||||||
| Alabama | 62 | 84 | 451 | 1,398 | 1,160 | 1,160 |
| California | 339 | 351 | 979 | 3,506 | 3,144 | 3,276 |
| Colorado | 85 | 52 | 58 | 141 | 69 | 71 |
| Delaware | 109 | 43 | 387 | 496 | 177 | 177 |
| Illinois | 97 | 99 | 212 | 311 | 251 | 251 |
| Indiana | 93 | 366 | 577 | 705 | 660 | 661 |
| Iowa | 204 | 199 | 483 | 687 | 345 | 348 |
| Maryland | 146 | 82 | 599 | 759 | 458 | 458 |
| Missouri | 235 | 381 | 2,415 | 3,089 | 3,012 | 3,012 |
| New Jersey | 85 | 9 | 0 | 85 | 10 | 10 |
| Oklahoma | 16 | 64 | 367 | 549 | 465 | 465 |
| Texas | 113 | 129 | 648 | 4,077 | 4,844 | 4,845 |
| Virginia | 54 | 96 | 267 | 338 | 312 | 312 |
| Washington | 45 | 91 | 97 | 142 | 190 | 195 |
| West Virginia | 16 | 41 | 4 | 4 | 47 | 47 |
| Other sections | 89 | 87 | 3,891 | 27,884 | 23,965 | 23,965 |
| Total | 1,788 | 2,174 | 11,435 | 44,172 | 39,109 | 39,253 |
| WHITE POTATOES. | ||||||
| Leading States: | ||||||
| Calif., N. dist. | 760 | 1,048 | 686 | 2,106 | 3,477 | 8,414 |
| Colorado | 2,819 | 1,939 | 911 | 3,846 | 2,468 | 11,321 |
| Idaho | 1,360 | 689 | 1,938 | 3,504 | 1,532 | 8,097 |
| Iowa | 25 | 237 | 5 | 33 | 284 | 897 |
| Maine | 4,424 | 1,126 | 543 | 5,122 | 1,232 | 17,755 |
| Michigan | 730 | 480 | 4 | 789 | 523 | 14,463 |
| Minnesota | 4,686 | 2,770 | 955 | 5,930 | 4,226 | 23,109 |
| Montana | 192 | 12 | 20 | 225 | 23 | 907 |
| Nebraska | 891 | 338 | 429 | 1,654 | 516 | 3,019 |
| Nevada | 3 | 0 | 0 | 4 | 1 | 405 |
| N. Y., Long Island | 881 | 899 | 1,342 | 2,446 | 1,302 | 5,503 |
| N. Y., other | 1,155 | 99 | 11 | 1,256 | 104 | 10,399 |
| North Dakota | 2,085 | 115 | 14 | 2,387 | 135 | 1,811 |
| Oregon | 21 | 0 | 99 | 124 | 8 | 1,476 |
| Pennsylvania | 390 | 331 | 63 | 467 | 351 | 6,259 |
| South Dakota | 1,035 | 242 | 15 | 1,168 | 296 | 1,880 |
| Utah | 150 | 111 | 478 | 816 | 339 | 563 |
| Washington | 379 | 288 | 187 | 703 | 453 | 3,657 |
| Wisconsin | 655 | 450 | 76 | 768 | 506 | 18,154 |
| Total | 22,641 | 11,174 | 7,776 | 33,348 | 17,806 | 138,089 |
| Other States, main crop: | ||||||
| Kansas | 135 | 24 | 1,130 | 2,371 | 1,931 | 1,980 |
| Missouri | 16 | 1 | 79 | 269 | 217 | 224 |
| New Jersey | 1,627 | 6,282 | 5,568 | 9,215 | 13,165 | 17,138 |
| Va., Western shore | 38 | 73 | 75 | 387 | 127 | 268 |
| Wyoming | 168 | 114 | 4 | 200 | 125 | 523 |
| Other sections | 67 | 383 | 936 | 23,079 | 19,526 | 22,782 |
| Total | 2,051 | 6,877 | 7,792 | 35,521 | 35,091 | 42,915 |
| Summary. | ||||||
| Leading States, main crop | 22,641 | 11,174 | 7,776 | 33,348 | 17,806 | 138,089 |
| Other States, main crop | 2,051 | 6,877 | 7,792 | 35,521 | 35,091 | 42,915 |
| States through shipping | 15 | 6 | 71 | 11,691 | 12,936 | 13,058 |
| Total | 24,707 | 18,057 | 15,639 | 80,560 | 65,833 | 194,082 |
| PEARS. | ||||||
| California | 378 | 362 | 1,814 | 3,568 | 4,318 | 4,581 |
| Colorado | 321 | 248 | 335 | 687 | 494 | 604 |
| Michigan | 365 | 391 | 103 | 472 | 497 | 1,142 |
| New Jersey | 17 | 3 | 2 | 19 | 4 | 35 |
| New York | 1,175 | 1,625 | 1,044 | 2,296 | 1,946 | 4,127 |
| Oregon | 371 | 377 | 442 | 816 | 660 | 845 |
| Utah | 11 | 49 | 19 | 30 | 70 | 75 |
| Washington | 1,125 | 857 | 1,236 | 2,401 | 1,377 | 1,896 |
| Other sections | 30 | 938 | 94 | 169 | 1,096 | 1,875 |
| Total | 3,793 | 4,850 | 5,089 | 10,458 | 10,462 | 15,180 |
| TOMATOES. | ||||||
| Calif., N. dist. | 41 | 246 | 12 | 134 | 407 | 741 |
| Calif., S. dist. | 172 | 190 | 81 | 570 | 416 | 771 |
| Delaware | 153 | 121 | 19 | 173 | 147 | 153 |
| Indiana | 204 | 814 | 44 | 255 | 941 | 1,137 |
| Kentucky | 193 | 370 | 168 | 364 | 551 | 559 |
| New Jersey | 808 | 671 | 236 | 1,896 | 2,147 | 2,346 |
| New York | 715 | 501 | 321 | 973 | 590 | 849 |
| Ohio | 93 | 74 | 20 | 296 | 287 | 330 |
| Utah | 65 | 197 | 4 | 69 | 220 | 251 |
| Other sections | 24 | 250 | 90 | 10,344 | 7,946 | 7,999 |
| Total | 2,468 | 3,434 | 995 | 15,074 | 13,652 | 15,136 |
| MIXED VEGETABLES. | ||||||
| Calif., N. dist. | 50 | 101 | 65 | 694 | 1,385 | 1,622 |
| Calif., S. dist. | 124 | 155 | 111 | 2,610 | 3,102 | 4,659 |
| Colorado | 305 | 354 | 157 | 644 | 726 | 1,318 |
| Michigan | 48 | 1 | 17 | 81 | 1 | 14 |
| Minnesota | 14 | 10 | 8 | 37 | 49 | 68 |
| New Jersey | 636 | 193 | 796 | 2,239 | 553 | 795 |
| New York | 65 | 57 | 55 | 133 | 85 | 472 |
| North Carolina | 13 | 13 | 8 | 29 | 100 | 184 |
| Ohio | 13 | 5 | 25 | 162 | 11 | 259 |
| Utah | 12 | 16 | 2 | 15 | 34 | 52 |
| Virginia | 30 | 0 | 68 | 197 | 225 | 280 |
| Other sections | 13 | 42 | 68 | 5,499 | 3,182 | 3,561 |
| Total | 1,323 | 947 | 1,380 | 12,340 | 9,453 | 13,284 |
CARLOAD SHIPMENTS OF CITRUS FRUITS.
| Florida. | California. | ||||
|---|---|---|---|---|---|
| Oranges. | Grape- fruit. |
Oranges. | Grape- fruit. |
Lemons. | |
| Cars. | Cars. | Cars. | Cars. | Cars. | |
| April | 1,729 | 1,047 | 6,124 | 25 | 1,120 |
| May | 612 | 782 | 5,682 | 32 | 1,461 |
| June | 10 | 24 | 5,388 | 43 | 2,213 |
| July | ... | ... | 3,064 | 62 | 1,801 |
| August | 1 | ... | 2,978 | 45 | 573 |
Prices of apples in barrels continued firm in the New York market throughout the week from Sept. 26 to Oct. 1, principally on account of light arrivals of good stock. Prices of boxed stock declined on account of heavier arrivals, but the trade is still looking for large red stock, and taking it readily.
Potatoes continued in light demand with very liberal supplies, and prices gradually declined until Maine Cobblers in 165-lb. sacks reached $2.75 to $3, with few buyers.
Receipts of good onions were light with prices firm.
Peaches from New York were in light supply and mostly of only fair condition and poor color. Demand was moderate with good stock selling readily for $4.50 to $5 a bu.; ordinary and poor stock sold slowly in a $2 to $4 range.
Sweet potatoes eased off considerably in price. Grapes were dull throughout the week selling slowly at the lowest figures yet realized. Cabbage was not in demand and prices gradually declined closing at $30 to $35 per ton for New York domestic. The first car of California tomatoes arrived on Thursday, but with heavy supplies of nearby stock on hand, did not sell so readily as was anticipated. The tomatoes were in excellent condition, with a few slightly overripe. Best lugs sold at $1.75 to $2 with ripe stock at $1.50, but were not cleaned up and sold at $1.25 to $1.50 the following day.

Butter trading was on a more confident basis during the week ending Oct. 1 and the markets developed a steadier tone as a result of definite information regarding the quantities of Danish butter expected to be available in the near future. The persistent rumors of large shipments which during the previous week were partly responsible for the unsettled condition were soon quieted, and operators took a more conservative attitude. There was less pressure to sell and buyers were inclined to purchase more freely.
Price changes were small, but there was a general tendency toward a higher level, advances of 1⁄2¢ to 1¢ being registered on all markets on the finer grades of butter. At times the supply of fancy butter was somewhat in excess of the demand, but any efforts on the part of the sellers to get prices down were always met with an active buying demand from distributors and speculators. It was a good, steady market with holders usually free sellers and buyers taking immediate requirements readily at current prices.
The market for undergrades was somewhat more active. The heavy supply of last week showed but little if any reduction, and current receipts consisted largely of undergrade butter. The quality of receipts generally was reported considerably better during the week and this no doubt was largely the cause of the improved market in undergrades. More interest was shown in undergrades by buyers who bought for immediate needs or who got such price concessions as to make their purchases bargains, but as a rule dealers found it impossible to move all their undergrades even at large price reductions.
Receipts for the week show but little change from previous weeks. It was generally expected that production would gradually decrease in spite of the fact that conditions for a good fall production have been favorable. Hence, the latest available report from the American Association of Creamery Butter Manufacturers showing an increase of 9.8% over last year and an increase of 0.44% over the previous week came as a surprise. The storage holdings for the four markets showed a marked decrease during the week. The decrease was most pronounced at Chicago, indicating a movement of storage butter from there to other markets.
The S. S. Frederick VIII arrived during the week, carrying a cargo of 1,250 casks of Danish butter, which did not become available until Friday. Part of this butter was reported sold at prices ranging from 443⁄4¢ to 451⁄2¢, depending upon the size of the lot. The S. S. Heligolav and Drottingholm now afloat with combined cargoes estimated at between 3,000 and 4,000 casks. The Oscar II, which sailed from Copenhagen on Sept. 30, is also expected to carry some butter. The effect of the Danish butter on the markets has been largely sentimental, causing operators to act somewhat more conservatively.
WHOLESALE PRICES OF BUTTER AND
CHEESE FOR WEEK ENDING OCT. 1.
[Cents per pound.]
| CREAMERY BUTTER (92 score). |
New York. |
Chi- cago. |
Phila- del- phia. |
Bos- ton. |
San Fran- cisco. |
|||||
|---|---|---|---|---|---|---|---|---|---|---|
| Monday | 44 | 43 | 45 | 44 | 44 | 1⁄2 | ||||
| Tuesday | 44 | 43 | 45 | 44 | 44 | 3⁄4 | ||||
| Wednesday | 44 | 43 | 45 | 45 | 44 | 3⁄4 | ||||
| Thursday | 44 | 43 | 3⁄4 | 45 | 45 | 45 | ||||
| Friday | 44 | 44 | 45 | 45 | 45 | 1⁄4 | ||||
| Saturday | 44 | 1⁄2 | 44 | 45 | 45 | 45 | ||||
| Average for week | 44 | .08 | 43 | .46 | 45 | .00 | 44 | .67 | 44 | .87 |
| Previous week | 44 | .00 | 42 | .50 | 44 | .58 | 44 | .33 | 43 | .71 |
| Corresponding week last year | 60 | .91 | 58 | .50 | 60 | .83 | 60 | .58 | 63 | .04 |
| AMERICAN CHEESE. (No. 1 fresh twins.) |
New York. |
Chi- cago. |
Bos- ton. |
San Fran- cisco.[1] |
Wis- con- sin. |
|||||
| Monday | 201⁄2-211⁄2 | 193⁄4-201⁄2 | 22-23 | 21 | 1⁄4 | 19 | 1⁄2 | |||
| Tuesday | 201⁄2-211⁄2 | 193⁄4-201⁄2 | 22-23 | 20 | 3⁄4 | 20 | 1⁄2 | |||
| Wednesday | 201⁄2-211⁄2 | 193⁄4-201⁄2 | 22-22 | 1⁄2 | 20 | 3⁄4 | 19 | 3⁄4 | ||
| Thursday | 201⁄2-211⁄2 | 193⁄4-201⁄2 | 22-22 | 1⁄2 | 20 | 3⁄4 | 19 | 3⁄4 | ||
| Friday | 201⁄2-211⁄2 | 193⁄4-201⁄2 | 22-22 | 1⁄2 | 20 | 3⁄4 | 19 | 5⁄8 | ||
| Saturday | 201⁄2-211⁄2 | 193⁄4-201⁄2 | 22-22 | 1⁄2 | 20 | 3⁄4 | 20 | |||
| Average for week | 21 | .00 | 20 | .13 | 22.33 | 20 | .83 | 19 | .85 | |
| Previous week | 20 | .87 | 20 | .00 | 21.42 | 21 | .29 | 19 | .58 | |
| Corresponding week last year | 27 | .63 | 26 | .56 | 29.91 | 33 | .25 | 26 | .46 | |
[1] Flats.
Wholesale Prices of Centralized Butter (90 score) at
Chicago.
[Cents per pound.]
| Monday | 37 | |
| Tuesday | 37 | 3⁄4 |
| Wednesday | 37 | 3⁄4 |
| Thursday | 38 | 1⁄4 |
| Friday | 38 | 1⁄2 |
| Saturday | 38 | 1⁄2 |
| Average | 37 | .96 |
MOVEMENT AT FIVE MARKETS.
[New York, Chicago, Philadelphia, Boston, and San
Francisco.]
| Week ending Oct. 1. |
Previous week. |
Last year. |
|
|---|---|---|---|
| BUTTER. | Pounds. | Pounds. | Pounds. |
| Receipts for week | 10,710,039 | 11,088,542 | 9,012,825 |
| Receipts since Jan. 1 | 448,180,161 | 437,470,122 | 397,422,337 |
| Put into cold storage | 1,561,618 | 2,554,239 | 2,424,626 |
| Withdrawn from cold storage | 2,565,222 | 2,667,180 | 1,976,443 |
| Change during week | -1,003,604 | -112,941 | +448,183 |
| Total holdings | 57,426,751 | 58,430,355 | 67,411,182 |
| CHEESE. | |||
| Receipts for week | 3,417,635 | 3,868,809 | 3,008,890 |
| Receipts since Jan. 1 | 141,117,659 | 137,700,024 | 130,569,677 |
| Put into cold storage | 1,193,333 | 1,153,107 | 821,381 |
| Withdrawn from cold storage | 1,840,048 | 1,364,127 | 1,109,790 |
| Change during week | -646,715 | -211,020 | -288,409 |
| Total holdings | 17,006,483 | 17,653,198 | 19,401,542 |
| DRESSED POULTRY. | |||
| Receipts for week | 4,180,468 | 4,190,630 | 3,097,825 |
| Receipts since Jan. 1 | 125,584,081 | 121,403,613 | 119,319,585 |
| Put into cold storage | 1,763,783 | 1,645,312 | 1,748,540 |
| Withdrawn from cold storage | 1,086,169 | 974,956 | 1,303,010 |
| Change during week | +677,614 | +670,356 | +445,530 |
| Total holdings | 18,302,642 | 17,625,028 | 15,835,021 |
| EGGS. | Cases. | Cases. | Cases. |
| Receipts for week | 208,045 | 198,651 | 178,819 |
| Receipts since Jan. 1 | 13,319,676 | 13,111,631 | 11,834,417 |
| Put into cold storage | 17,305 | 19,475 | 32,480 |
| Withdrawn from cold storage | 168,670 | 139,781 | 166,123 |
| Change during week | -151,365 | -120,306 | -133,643 |
| Total holdings | 3,134,054 | 3,285,419 | 2,589,382 |
Thirteen thousand six hundred and forty-three cases of frozen eggs weighing 1,200,564 lbs., also 448 cases of dried eggs weighing 48,800 lbs., were unloaded from the British steamship Gothicstar from China at San Francisco Sept. 15. The shipment is one of the largest ever received in this country.
On Sept. 19 the Gothicstar sailed for New York with a cargo of 59,108 cases of frozen eggs and 6,190 cases of dried eggs.
The tone of cheese markets was at least steady during the week ending Oct. 1, although prices which prevailed in Wisconsin during the week suggested a somewhat unsettled feeling. Prices on Wisconsin cheese boards advanced again Sept. 28, although the advances were for the most part small and were confined to the larger styles. Some dealers quoted prices representing very close margins, and this probably accounted for more or less variation in f. o. b. selling prices on different days of the week.
Daisies and Twins were good sellers throughout the week, Longhorns being the only style which was especially slow. Buying in the South showed a material increase. There was also considerable inquiry from southern buyers. Practically all of the southern business went direct to Wisconsin rather than through distributing market dealers.
The very low prices quoted by Canadian dealers and the resulting sales had a noticeable effect in distributing markets. Goods from Canada at prices around 171⁄4¢ to 18¢ delivered at New York looked so attractive to a number of buyers who anticipate heavier export demand later in the season, that considerable quantities were purchased. Only a small quantity of this cheese has actually been imported as yet, according to current reports, the bulk of it remaining in Canadian storages. The large Canadian Cheddars are not entirely suitable for our domestic trade, although in some markets certain dealers split them. They are used successfully, however, for grinding purposes and to some extent for making the small loaf cheese which has come into prominence the past season.
Retail distribution of cheese received an impetus during the week on account of the especially low retail prices advertised by large retailers, principally chain-store operators, in several eastern cities. Prices were reported as having been as low as 21¢ for cheese of good quality.
IMPORTS OF WOOL DURING AUGUST.
| Imported from— |
Class 1. Washed and un- washed. |
Class 2. Hair of Angora goat and alpaca. |
Class 3. | Total. | |
|---|---|---|---|---|---|
| Washed and un- washed. |
Scoured. | ||||
| Lbs. | Lbs. | Lbs. | Lbs. | Lbs. | |
| Belgium | ... | ... | 71,827 | ... | 71,827 |
| Czechoslovakia | ... | ... | 39,401 | ... | 39,401 |
| France | ... | ... | 244,723 | ... | 244,723 |
| Germany | ... | ... | 138,245 | ... | 138,245 |
| Italy | ... | ... | 438,731 | ... | 438,731 |
| Switzerland | ... | ... | 65,264 | ... | 65,264 |
| England | 10,700 | ... | 2,411,684 | 4,568 | 2,426,952 |
| Scotland | ... | ... | 866,950 | ... | 866,950 |
| Canada | 844 | ... | ... | ... | 844 |
| Argentina | 3,180,672 | ... | 421,529 | 33,981 | [1]3,637,031 |
| Peru | ... | 4,689 | ... | ... | 4,689 |
| Uruguay | 469,217 | ... | ... | ... | 469,217 |
| China | 53,444 | 26,026 | 6,118,041 | ... | 6,197,511 |
| British India | ... | ... | 451,018 | ... | 451,018 |
| Australia | 184,441 | ... | ... | ... | 184,441 |
| New Zealand | 268,175 | ... | ... | ... | 268,175 |
| British South Africa | 55,087 | 44,344 | 7,802 | 51,727 | [2]360,065 |
| Other countries | 660 | ... | 1,000 | ... | 1,660 |
| Total | 4,223,240 | 75,059 | 11,276,215 | 90,276 | 15,866,744 |
[1] Includes 849 lbs. of scoured wool, class 1.
[2] Includes 201,105 lbs. of scoured wool, class 1.

The wheat market closed lower every day except two during the week ending Monday, Oct. 3, and the net decline in the different markets was 6¢ to 101⁄2¢ for the December future and 5¢ to 81⁄2¢ for the May future. Corn was influenced by wheat and followed the fluctuations of the latter. The net loss in corn was 2¢ for the December future and 1¢ for the May future. Corn touched the lowest prices for the crop on Oct. 3. The September futures “went out” on the last day of September and except at Minneapolis, owing to local conditions in that market, at the low point for most September futures since early in July.
Closing prices of the September futures were: Chicago September wheat $1.161⁄8, September corn 47¢; Minneapolis September wheat $1.411⁄4; Kansas City September wheat $1.10. At Minneapolis, September wheat closed at 7¢ over December on the last day of September, owing to a strong milling demand for choice wheat.
The declines recorded in the December futures in the different markets during the week were: Chicago December wheat 61⁄4¢ and December corn 2¢; Minneapolis December wheat 101⁄2¢, Kansas City 6¢, and Winnipeg 83⁄4¢. The May futures recorded the following declines: Chicago May wheat 5¢, May corn 1¢; Minneapolis May wheat 8¢; Kansas City 51⁄4¢; and Winnipeg 81⁄2¢.
Closing prices on Oct. 3 were: Chicago December wheat $1.183⁄8, December corn 495⁄8¢; Minneapolis December wheat $1.281⁄2; Kansas City $1.101⁄4; and Winnipeg $1.221⁄4. The May futures closed as follows: Chicago May wheat $1.233⁄8, May corn 551⁄4¢; Minneapolis May wheat $1.291⁄2; Kansas City $1.15; and Winnipeg $1.27.
There were several important developments in the general situation. One of these was a report from New York that 20,000 bbls. of Canadian flour had been bought to come to that market. This, of course, had a depressing influence on wheat prices. During August 3,700 bbls. of flour and 239,000 bus. of wheat were imported from Canada. This was for domestic consumption and not for re-export at American ports. Another bearish development of the week was a report that Hard Winter wheat on passage for Europe had been sold at 11¢ under the price at which it could be replaced. It was also reported that Hard Winter wheat was being resold in London at 5¢ under the replacement cost.
All of the news was not bearish, however. A message from the Pacific coast early in the week reported that 12,000,000 to 15,000,000 bus. of Pacific coast wheat were under contract for shipment to the Orient. Also, on Oct. 3 a message reported an additional 1,250,000 bus. of wheat sold to Japan. The impression appears to be growing in the grain trade that the United States has probably already sold for export all the wheat that can be spared and that there will be a scarcity later in the season unless there are liberal importations from Canada.
There were some changes in the cash wheat markets. At Chicago a good demand developed for No. 2 Red Winter and supplies of that kind of wheat were scarce. The premium over the December strengthened and on Oct. 3 was 5¢ to 6¢. At the same time No. 2 Hard Winter sold at 1⁄4¢ to 1¢ over December. Receipts of wheat showed a decreasing tendency at Kansas City and the premium strengthened. On Oct. 3, No. 2 Dark Hard Winter sold at 11¢ over Kansas City December, as compared with 7¢ over on Sept. 26. During the week Kansas City December wheat declined 6¢ to $1.101⁄4. No. 2 Dark Hard at 11¢ over December sold at $1.211⁄4 as compared with $1.231⁄4 on Sept. 26. That is, cash wheat on Oct. 3 was only 2¢ lower than on Sept. 26. while the December future was 6¢ lower.
GRAIN PRICES.
Daily Average of Cash Sales at Certain Markets,
Week Ending Friday, Sept. 30.
[Cents per bushel.]
| WHEAT. | |||||||||||||
| Sat. | Mon. | Tue. | Wed. | Thr. | Fri. | ||||||||
|---|---|---|---|---|---|---|---|---|---|---|---|---|---|
| CHICAGO. | |||||||||||||
| Dark Nor. Spg. | No. 3 | 145 | ... | 145 | ... | ... | 144 | ||||||
| No. 4 | 134 | 1⁄2 | ... | 140 | ... | ... | 140 | ||||||
| Hard Winter | No. 2 | 126 | 1⁄2 | 121 | 1⁄2 | 124 | 122 | ... | ... | ||||
| Yellow Hard Winter | No. 2 | ... | 122 | 1⁄4 | 120 | ... | ... | 117 | 1⁄2 | ||||
| No. 3 | 122 | 1⁄2 | 120 | 3⁄4 | 118 | 1⁄2 | ... | ... | ... | ||||
| Red Winter | No. 2 | ... | ... | 124 | 1⁄2 | ... | ... | 126 | |||||
| MINNEAPOLIS. | |||||||||||||
| Dark Nor. Spg. | No. 1 | 160 | 159 | 158 | 155 | 154 | 155 | ||||||
| No. 2 | 157 | 155 | 153 | 152 | 148 | 151 | |||||||
| No. 3 | 151 | 148 | 148 | 146 | 142 | 144 | |||||||
| No. 4 | 143 | 140 | 139 | 138 | 134 | 135 | |||||||
| Nor. Spg. | No. 1 | 153 | 152 | 150 | 149 | 149 | 150 | ||||||
| No. 2 | 145 | ... | 148 | 147 | 144 | 146 | |||||||
| No. 3 | ... | 142 | 137 | 137 | 132 | 137 | |||||||
| No. 4 | 136 | 135 | 134 | 128 | 130 | 125 | |||||||
| KANSAS CITY. | |||||||||||||
| Dark Hrd. Wir. | No. 1 | ... | ... | 133 | 127 | 1⁄2 | 120 | 124 | |||||
| No. 2 | 133 | 3⁄4 | 134 | 3⁄4 | 131 | 1⁄4 | 129 | 3⁄4 | 126 | 7⁄8 | 130 | ||
| No. 3 | 129 | 3⁄4 | 132 | 3⁄8 | 133 | 126 | 5⁄8 | 122 | 3⁄4 | 126 | |||
| No. 4 | 127 | ... | 130 | 124 | ... | 124 | |||||||
| Hard Winter | No. 1 | 122 | 118 | 3⁄4 | 120 | 1⁄4 | 117 | 3⁄8 | 119 | 1⁄2 | 122 | 1⁄2 | |
| No. 2 | 122 | 1⁄2 | 121 | 5⁄8 | 122 | 5⁄8 | 119 | 119 | 3⁄8 | 119 | 1⁄4 | ||
| No. 3 | 120 | 1⁄4 | 123 | 3⁄4 | 121 | 3⁄4 | 120 | 118 | 1⁄2 | 117 | 7⁄8 | ||
| No. 4 | ... | 118 | 118 | 5⁄8 | ... | 116 | 5⁄8 | 115 | 3⁄4 | ||||
| Yellow Hard Winter | No. 2 | 119 | 117 | 115 | 1⁄2 | 113 | 5⁄8 | ... | ... | ||||
| Red Winter | No. 2 | ... | 132 | 130 | 130 | 128 | ... | ||||||
| No. 3 | ... | 127 | 125 | 3⁄8 | 123 | 120 | 120 | ||||||
| No. 4 | ... | 110 | 111 | 5⁄8 | 113 | 1⁄2 | 112 | ... | |||||
| OMAHA. | |||||||||||||
| Dark Hrd. Wir. | No. 2 | ... | 122 | 120 | 118 | ||||||||
| Hard Winter | No. 1 | 118 | 3⁄8 | 116 | 116 | 116 | 114 | 3⁄8 | 113 | 1⁄2 | |||
| No. 2 | 118 | 3⁄4 | 116 | 1⁄4 | 114 | 1⁄8 | 114 | 3⁄4 | 113 | 3⁄8 | 112 | 1⁄2 | |
| No. 3 | 117 | 118 | 115 | 111 | 3⁄4 | 111 | |||||||
| Yellow Hard Winter | No. 2 | 115 | 115 | 133 | 112 | 1⁄4 | 112 | 3⁄8 | 112 | 1⁄4 | |||
| No. 3 | 113 | 112 | 110 | 3⁄4 | 110 | 110 | 5⁄8 | 111 | |||||
| No. 4 | ... | 111 | 109 | 1⁄2 | ... | ... | 109 | ||||||
| ST. LOUIS. | |||||||||||||
| Red Winter | No. 2 | 139 | 5⁄8 | 137 | 1⁄4 | 136 | 133 | 3⁄4 | 133 | 1⁄4 | 135 | 1⁄8 | |
| No. 3 | 130 | 7⁄8 | 130 | 7⁄8 | [1]129 | 126 | 3⁄4 | 124 | 1⁄4 | 129 | 3⁄4 | ||
| No. 4 | 127 | 125 | [1]121 | 116 | 1⁄4 | 113 | 1⁄2 | 116 | 1⁄2 | ||||
| CORN. | |||||||||||||
| CHICAGO. | |||||||||||||
| White | No. 1 | 53 | 3⁄4 | 52 | 3⁄4 | 51 | 3⁄4 | 50 | 1⁄4 | 49 | 48 | 1⁄4 | |
| No. 2 | 53 | 3⁄4 | 52 | 3⁄4 | 51 | 3⁄4 | 50 | 1⁄4 | 48 | 3⁄4 | 48 | 1⁄4 | |
| No. 3 | 53 | 1⁄4 | 51 | 3⁄4 | 51 | ... | ... | 48 | |||||
| Yellow | No. 1 | 54 | 52 | 3⁄4 | 51 | 3⁄4 | 50 | 3⁄4 | 49 | 3⁄4 | 48 | 1⁄2 | |
| No. 2 | 53 | 3⁄4 | 52 | 3⁄4 | 51 | 3⁄4 | 50 | 3⁄4 | 49 | 1⁄4 | 48 | 1⁄2 | |
| No. 3 | 53 | 1⁄4 | 52 | 1⁄4 | 51 | 1⁄2 | 50 | 1⁄4 | 48 | 3⁄4 | 47 | 3⁄4 | |
| Mixed | No. 1 | 53 | 3⁄4 | 52 | 3⁄4 | 51 | 1⁄2 | 50 | 48 | 3⁄4 | 48 | 1⁄4 | |
| No. 2 | 53 | 1⁄2 | 52 | 1⁄2 | 51 | 1⁄2 | 50 | 48 | 3⁄4 | 48 | 1⁄4 | ||
| No. 3 | 53 | 1⁄4 | 52 | 1⁄4 | 51 | ... | 48 | 1⁄2 | 47 | 3⁄4 | |||
| No. 4 | ... | ... | 50 | 3⁄4 | ... | 48 | 47 | 1⁄4 | |||||
| MINNEAPOLIS. | |||||||||||||
| Yellow | No. 1 | 47 | 46 | 1⁄4 | 45 | 1⁄4 | 44 | 1⁄2 | 43 | 1⁄2 | 42 | 3⁄4 | |
| No. 2 | 47 | 46 | 1⁄2 | 45 | 44 | 42 | 1⁄2 | 43 | |||||
| KANSAS CITY. | |||||||||||||
| White | No. 1 | ... | 46 | 1⁄2 | 46 | 1⁄2 | ... | 45 | 43 | 1⁄2 | |||
| No. 2 | 46 | 3⁄4 | 46 | 46 | 1⁄4 | ... | ... | 43 | 3⁄4 | ||||
| Yellow | No. 1 | 47 | 45 | 3⁄4 | 45 | 3⁄4 | 46 | 45 | 1⁄2 | 44 | |||
| No. 2 | 46 | 1⁄2 | 45 | 1⁄8 | 45 | 1⁄2 | 45 | 45 | 44 | ||||
| Mixed | No. 2 | 43 | 1⁄2 | 43 | 3⁄8 | ... | ... | ... | 40 | 1⁄2 | |||
| OMAHA. | |||||||||||||
| White | No. 1 | 42 | 1⁄2 | 42 | 1⁄8 | 41 | 3⁄4 | 40 | 1⁄2 | 39 | 1⁄2 | 38 | 1⁄2 |
| No. 2 | 42 | 1⁄2 | 42 | 1⁄2 | ... | 40 | 40 | 38 | 1⁄2 | ||||
| Yellow | No. 1 | 42 | 5⁄8 | 42 | 41 | 1⁄2 | 40 | 1⁄2 | 39 | 1⁄2 | 38 | 3⁄4 | |
| No. 2 | 42 | 5⁄8 | 42 | 41 | 1⁄2 | 40 | 1⁄2 | ... | 38 | 7⁄8 | |||
| No. 3 | 43 | 1⁄2 | ... | ... | 40 | 1⁄4 | ... | 38 | 1⁄2 | ||||
| Mixed | No. 1 | 41 | 1⁄2 | 41 | 1⁄4 | 41 | 40 | 39 | 7⁄8 | 38 | 5⁄8 | ||
| No. 2 | 41 | 7⁄8 | 41 | 41 | 40 | 39 | 1⁄4 | 38 | 5⁄8 | ||||
| ST. LOUIS. | |||||||||||||
| White | No. 1 | ... | 50 | 7⁄8 | 50 | 1⁄2 | 48 | 7⁄8 | 48 | 33 | 1⁄4 | ||
| No. 2 | 52 | 1⁄2 | 51 | 50 | 48 | 3⁄4 | 48 | 33 | 1⁄4 | ||||
| No. 4 | ... | 49 | ... | 44 | 44 | ... | |||||||
| Yellow | No. 1 | 52 | 1⁄8 | 50 | 5⁄8 | [1]50 | 1⁄2 | 49 | 1⁄8 | 48 | 47 | 1⁄2 | |
| No. 2 | 52 | 50 | 5⁄8 | 50 | 49 | 48 | 47 | 1⁄4 | |||||
| No. 3 | 51 | 1⁄2 | 50 | 49 | ... | 47 | 46 | 1⁄2 | |||||
| No. 4 | 50 | ... | 48 | 1⁄2 | ... | ... | 45 | 1⁄2 | |||||
| OATS. | |||||||||||||
| CHICAGO. | |||||||||||||
| White | No. 2 | 37 | 36 | 1⁄2 | 36 | 1⁄4 | 37 | 35 | 35 | ||||
| No. 3 | 34 | 1⁄2 | 34 | 33 | 1⁄2 | 32 | 3⁄4 | 32 | 3⁄4 | 33 | |||
| No. 4 | 33 | 3⁄4 | 33 | 32 | 3⁄4 | 32 | 31 | 3⁄4 | 32 | 1⁄4 | |||
| MINNEAPOLIS. | |||||||||||||
| White | No. 2 | 34 | 1⁄2 | 33 | 3⁄4 | 33 | 32 | 1⁄4 | 32 | 32 | 1⁄2 | ||
| No. 3 | 33 | 1⁄4 | 32 | 1⁄2 | 32 | 31 | 1⁄4 | 31 | 31 | ||||
| No. 4 | 32 | 1⁄2 | 31 | 1⁄2 | 31 | 31 | 1⁄4 | 31 | 30 | 1⁄2 | |||
| KANSAS CITY. | |||||||||||||
| White | No. 3 | 35 | 5⁄8 | 35 | 3⁄8 | 34 | 3⁄8 | 33 | 1⁄2 | 33 | 5⁄8 | 33 | 3⁄8 |
| No. 4 | ... | 34 | 1⁄2 | 33 | 3⁄8 | ... | 33 | 1⁄4 | ... | ||||
| OMAHA. | |||||||||||||
| White | No. 3 | 31 | 3⁄4 | 31 | 1⁄4 | 30 | 7⁄8 | 29 | 7⁄8 | 30 | 30 | ||
| No. 4 | 31 | 30 | 1⁄2 | 30 | 29 | 1⁄2 | 29 | 1⁄2 | 29 | 1⁄2 | |||
| ST. LOUIS. | |||||||||||||
| White | No. 2 | ... | 37 | 1⁄2 | [1]37 | 1⁄2 | 35 | 3⁄4 | 35 | 1⁄4 | ... | ||
| No. 3 | 36 | 1⁄8 | 36 | 1⁄2 | [1]36 | 34 | 1⁄2 | 34 | 1⁄2 | 34 | 1⁄4 | ||
| No. 4 | 35 | 34 | 3⁄4 | 34 | 1⁄2 | 33 | 3⁄4 | 33 | 3⁄4 | 33 | 1⁄2 | ||
| RYE. | |||||||||||||
| CHICAGO. | |||||||||||||
| No. 2 | 104 | 1⁄2 | 102 | 100 | 3⁄4 | 100 | 1⁄4 | 99 | ... | ||||
| MINNEAPOLIS. | |||||||||||||
| Western | No. 2 | 99 | 97 | 1⁄2 | 96 | 94 | 1⁄2 | 93 | 92 | ||||
| Daily Closing Prices of Futures. | |||||||||||||
| CHICAGO. | |||||||||||||
| Wheat | Sept. | 123 | 1⁄2 | 121 | 1⁄2 | 119 | 1⁄2 | 117 | 1⁄4 | 118 | 1⁄4 | 116 | |
| Dec. | 126 | 126 | 1⁄2 | 123 | 1⁄4 | 120 | 7⁄8 | 123 | 120 | 3⁄4 | |||
| Corn | Sept. | 52 | 1⁄4 | 51 | 50 | 7⁄8 | 49 | 48 | 1⁄2 | 47 | |||
| Dec. | 52 | 3⁄8 | 51 | 3⁄4 | 51 | 3⁄8 | 50 | 1⁄8 | 50 | 49 | 5⁄8 | ||
| Oats | Sept. | 35 | 34 | 3⁄8 | 34 | 33 | 3⁄8 | 33 | 1⁄4 | 32 | 1⁄2 | ||
| Dec. | 37 | 3⁄4 | 37 | 1⁄4 | 37 | 1⁄2 | 36 | 3⁄8 | 36 | 5⁄8 | 36 | 3⁄8 | |
| KANSAS CITY. | |||||||||||||
| Wheat | Sept. | 116 | 114 | 112 | 1⁄2 | 111 | 110 | 3⁄4 | 110 | ||||
| Dec. | 117 | 3⁄4 | 116 | 1⁄4 | 115 | 1⁄8 | 113 | 1⁄8 | 114 | 3⁄4 | 112 | ||
| May | 121 | 3⁄4 | 120 | 1⁄4 | 119 | 5⁄8 | 117 | 3⁄4 | 119 | 3⁄8 | 117 | 1⁄8 | |
| Corn | Sept. | 42 | 7⁄8 | 42 | 1⁄2 | 41 | 1⁄4 | 40 | 1⁄2 | 39 | 5⁄8 | 39 | |
| Dec. | 44 | 1⁄2 | 43 | 5⁄8 | 43 | 1⁄4 | 42 | 1⁄8 | 41 | 7⁄8 | 41 | 1⁄4 | |
| May | 48 | 3⁄4 | 48 | 47 | 7⁄8 | 46 | 7⁄8 | 46 | 7⁄8 | 46 | 3⁄8 | ||
| Oats | Sept. | 34 | 34 | 34 | 34 | 34 | 33 | 3⁄4 | |||||
| Dec. | 35 | 1⁄2 | 35 | 34 | 3⁄4 | 34 | 34 | 33 | 5⁄8 | ||||
[1] Common average.
Cash wheat at Minneapolis declined 2¢ to 5¢ for No. 1 Dark Northern, and 4¢ for No. 2, more than the December future declined. On Oct. 3, No. 1 Dark Northern sold at 10¢ to 18¢ over Minneapolis December and No. 2 at 6¢ to 12¢ over. The weakness in the cash market at Minneapolis was caused by a poor flour demand and increasing receipts of spring wheat. Reports from Minneapolis for some time past have reflected a very poor demand for flour.
The visible supply statement issued on Oct. 3 showed an increase of 1,636,000 bus. of wheat for the week. The total on that date was 52,795,000 bus. compared with 27,391,000 a year ago. The supply statement also showed a decrease of 726,000 bus. of corn for the week, making the total 11,765,000 compared with 7,587,000 a year ago. In the Chicago market on Oct. 3 No. 2 Mixed corn sold at 2¢ to 21⁄4¢ under December and No. 2 Yellow at 13⁄4¢ to 2¢ under.
GRAIN EXPORTS.
Wheat Inspected Out Under American Grades Only—Flour
Not Included.
[Thousands of bushels: i. e., 000 omitted.]
| Wheat. | Corn. | Oats. | Barley. | Rye. | |
|---|---|---|---|---|---|
| Week ending Oct. 1: | |||||
| Atlantic ports[1] | 2,061 | 157 | ... | 101 | 214 |
| Gulf ports[2] | 2,330 | 158 | 9 | ... | ... |
| Pacific ports[3] | 1,149 | ... | ... | 483 | ... |
| Total | 5,540 | 315 | 9 | 584 | 214 |
| Previous week | 4,379 | 193 | 12 | 2,031 | 186 |
| Corresponding week last year | 7,417 | ... | 67 | 104 | 623 |
| Total, July 1 to Oct. 1, 1921 | 85,223 | 6,581 | 344 | 11,357 | 2,528 |
| Corresponding period last year | 83,750 | 97 | 2,057 | 5,545 | 11,469 |
[1] Boston, New York, Philadelphia, Baltimore, Portland, Me., and Newport News.
[2] New Orleans, Galveston, Texas City, and Port Arthur, Tex.
[3] Seattle, Tacoma, Astoria, Portland, Oreg., and San Francisco.
AVERAGE PRICES PER BUSHEL OF CERTAIN GRADES OF WHEAT, CORN, AND OATS AT FOUR MARKETS.
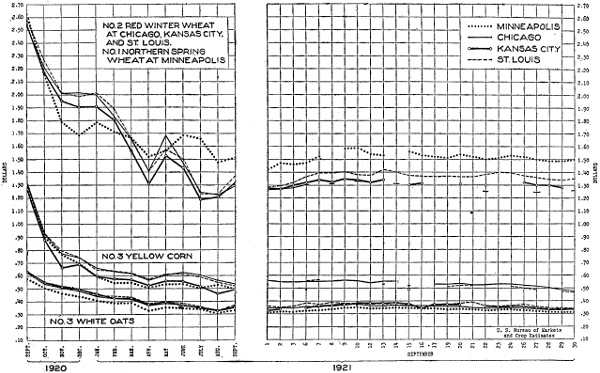
A new schedule of grain rates for the North Atlantic service has been announced by the Shipping Board, as the outcome of a joint conference of shipping companies recently held in New York. The old and new rates on wheat and corn per 100 lbs. from North Atlantic ports are as follows:
| To— | Old rate. |
New rate. |
||
|---|---|---|---|---|
| Cents. | Cents. | |||
| United Kingdom | 21 | 17 | ||
| Antwerp | 22 | 1⁄2 | 16 | 1⁄2 |
| Hamburg | 22 | 1⁄2 | 18 | |
Wheat flour, which takes a differential of 55¢ per 100 lbs., will be subject to a corresponding reduction, making the new rates on flour per 100 lbs. as follows: To the United Kingdom, 22¢; to Antwerp, 21¢; and to Hamburg, 23¢.
Growers in southern Wisconsin had disposed of 80% of their crop of white clover seed by the end of September. The prevailing prices ranging from $30 to $40 per 100 lbs. have been fairly satisfactory to growers. The quality of the seed varies in different localities but probably averages about the same as or slightly inferior to that of last year because more of it is reported mixed with alsike and timothy.
The imports of white clover seed, principally from Germany, have tended to stabilize prices for the short crop of American seed. From July 1 to Sept. 30 there was permitted entry 538,600 lbs. and none for the same period last year.
Exports of timothy seed from New York during the two weeks ending Oct. 1, were 550,000 lbs. to Great Britain, 75,000 lbs. to Denmark, 40,000 lbs. to Germany, and 20,000 lbs. to Holland. Exports of Kentucky bluegrass from New York and Baltimore were 21,000 lbs. to Holland, 28,000 lbs. to Great Britain, and 16,500 lbs. to Germany.
The arrivals of imported seed at New York and Baltimore during the same period were: Alfalfa, 425,000 lbs. from Argentina; red clover, 113,000 lbs. from Germany, 92,000 lbs. from France, and 44,000 lbs. from Chile; white clover, 22,000 lbs. from Denmark and 11,000 lbs. from Holland; crimson clover, 105,000 lbs. from Germany; orchard grass, 179,000 lbs. from Denmark, 121,000 lbs. from Germany, and 45,000 lbs. from Holland; sunflower, 560,000 lbs. and canary, 128,000 lbs. from Argentina; rape, 187,000 lbs. from Holland and 44,000 lbs. from France; vetch, 57,000 lbs. from Sweden and 11,600 lbs. from Germany; rye grass, 22,000 lbs. from Great Britain; and grass (kind not specified) 123,000 lbs. from Argentina.
The Government of Egypt is now considering a plan whereby it will assume control over all cotton seed used for planting purposes to preserve the standard varieties in a state of purity and to facilitate the propagation of new varieties under the most favorable conditions.
The history of the cotton industry in Egypt shows that a great number of cotton varieties have been planted which after a period of commercial popularity have almost disappeared from cultivation. Under the plan now being proposed no private person or firm will be permitted to engage in the selection or production of new varieties or strains of cotton unless licensed to do so, and even then not more than 200 acres may be devoted to the experiment. The area to be so planted must furthermore first undergo a field test for at least two years under the direction of the ministry of agriculture.
If the experiment proves satisfactory the seed obtained from the new variety or strain will be propagated and distributed by the Government under the name registered by the original producer. The Government will allow the producer a royalty on all seed used or sold for planting purposes, but will reserve the right to limit the rate of, or to discontinue entirely, its propagation.
Further information on this proposed control plan may be obtained upon request to the Bureau of Markets and Crop Estimates, Washington, D. C.
The economic importance of seeds is perhaps greater than that of any other farm commodity. Seeds are potential plants. Practically all staple foods are derived, either directly or indirectly, from plants. A shortage of seed in any country or section of a country may mean a shortage of food. The commercial supply of seeds in the United States safeguards every section of this country against a deficiency in the necessary requirements for planting annually and indirectly helps to maintain the stocks of food at uniform levels.
The best commercial grades of red clover, alfalfa, and timothy seed test 99.5% or better in purity.

A continued light movement of hay to market prevailed during the week ending Oct. 1 and with the exception of one or two markets prices were but little changed from the preceding week.
The average price of No. 1 timothy at the principal timothy markets is now about $23.50 per ton, with the alfalfa average price about $22.75. This is $10 less per ton for both kinds than the prevailing average price Oct. 1, 1920. There is a fair local demand in limited quantities for the better grades of hay but scarcely any shipping demand and the lower grades are neglected. Good pastures and large local supplies of forage are important factors and will probably curtail demand for some time.
Receipts at nine of the important hay markets were practically the same as for the preceding week and totaled only a little over 1,000 cars compared with over 2,000 cars in the same markets at the corresponding time last year. The following table gives receipts of hay in several important markets for the weeks ending Sept. 24 and Oct. 1, 1921, and Oct. 2, 1920.
| Cities. | 1921 | 1920 | |
|---|---|---|---|
| Oct. 1. | Sept. 24. | Oct. 2. | |
| New York | 73 | 164 | 359 |
| Pittsburgh | 50 | 55 | 186 |
| Cincinnati | 93 | 66 | 219 |
| Chicago | 184 | 195 | 207 |
| Minneapolis-St. Paul | 67 | 36 | 18 |
| St. Louis | 152 | 105 | 215 |
| Kansas City | 189 | 139 | 1,019 |
| San Francisco | 78 | 107 | ... |
| Los Angeles | 144 | 150 | 78 |
Timothy.—Very light receipts of timothy at New York and efforts on the part of dealers to replenish their light stocks from the small quantity of hay arriving caused prices to advance $4 per ton during the week in that market. Buying was restricted, however, by the higher prices. Other eastern markets were practically unchanged. Good hay is scarce but equal to the light demand.
Prices at both the Pittsburgh and Cincinnati markets advanced $1 during the week, but the advance at Cincinnati was lost on Saturday because of a lack of support from shippers. Light receipts were almost entirely responsible for the firm market tone both at Chicago and St. Louis, as the demand was not large and was confined principally to local needs. At Chicago cars of choice hay in small bales sold at premiums of $1 to $2 over current quotations. Receipts on the North side increased and those on the South side decreased, so that the premium at which hay sold on the North side tracks last week was reduced about $1 per ton.
There was very little activity in the southern markets during the week. Stocks are light, but buying is only for the light local demand. Richmond reports a good demand for No. 1 clover hay, of which very little is being offered.
Alfalfa.—The alfalfa market showed some advances during the week, but prices were not materially higher. A better demand from southern and southeastern consuming sections and from interior Kansas points, where supplies are relatively small, was reported at Kansas City. Los Angeles also reports an increased demand for good grades. Choice dairy and rabbit hay is selling at a good premium over No. 1 and standard alfalfa. A sharp demand for fertilizer alfalfa is also reported from southern California.
Further shipments of alfalfa from San Francisco to the New England States were made during the week, but local demand in that market is very light. The movement of alfalfa in other Western States is light, caused principally by the light feeding demand and high freight rates.
Prairie.—More favorable weather has resulted in larger receipts of prairie hay at Minneapolis. The market remained steady, however, because of buying by the local stockyard. Firm prices on timothy and light receipts of prairie totaling only six cars for the week caused a firm market at Chicago also. The light receipts were attributed to the low prices which prevailed a short time ago. Increased receipts at Kansas City, caused apparently by the recent high prices, are more than equal to the limited demand and the market for prairie is weak with prices somewhat lower than last week. There was a good local demand from the stockyards, but practically no shipping demand, which is required to absorb any materially increased receipts. But little change is expected until colder weather arrives.
Straw.—Light receipts of straw caused slight price advances in several markets. Demand is light, however, and would not absorb a large increase in receipts except at price concessions. The following quotations represent current prices: No. 1 wheat straw—Philadelphia $12, Pittsburgh $11.50, Richmond $13, Cincinnati $9, Chicago $11.50, Minneapolis and Kansas City $8; No. 1 oat straw—Philadelphia and Pittsburgh $12, Cincinnati $11, Chicago $12.50, Minneapolis $9, Kansas City $8; No. 1 rye straw (straight)—New York $22.50, Philadelphia $20; (tangled) Pittsburgh $12.50, Chicago $13.50, Cincinnati and Minneapolis $9.
The feed market throughout the country was very dull and weak for the week ending Oct. 1. There was practically no investment buying of any commodity and dealers were supplying their immediate needs only. Prices generally are weak and in some markets lower on several feeds.
Production of wheat and corn feeds remains fairly heavy. Cotton seed in some sections is moving more freely and meal mills are expected to increase their offerings. Feed shipments from Minneapolis mills were heavy and stocks in public warehouses at lake ports are increasing. Approximately 28,750 tons of wheat feeds were reported in these warehouses at the end of the week under review, compared with about 2,200 tons at the corresponding time last year.
Wheat mill feeds.—Continued heavy production of bran and middlings, together with a lack of sufficient demand to absorb the offerings, resulted in a very weak feed market during the week. The lower grain prices were also a bearish factor. Bran was especially dull. Both mills and jobbers were pressing sales in some markets. Some distress bran was in evidence at both Chicago and Cincinnati. Hard winter bran sold as low as $10 per ton on track at Kansas City.
CARLOAD PRICES OF HAY AND FEED AT IMPORTANT MARKETS, OCT. 1.
[In dollars per ton.]
| Commodity. | New York. [1] |
Phila- del- phia. |
Rich- mond. |
At- lanta. |
Sa- van- nah. |
Mem- phis. [1] |
St. Louis. [1] |
Pitts- burgh. [1] |
Cin- cinnati. [1] |
Chi- cago. [1] |
Min- nea- polis. [1] |
Omaha. [1] |
Kan- sas City. [1] |
San Fran- cisco. [1] |
Los Angeles. [1] |
|
|---|---|---|---|---|---|---|---|---|---|---|---|---|---|---|---|---|
| HAY. | ||||||||||||||||
| Timothy and clover: | ||||||||||||||||
| No. 1 timothy | 31.00 | 23.00 | 26.00 | 28.00 | 26.50 | 24.50 | 25.00 | 22.50 | 20.00 | 24.00 | 19.50 | ... | [2]14.50 | ... | ... | |
| Standard timothy | 30.50 | 22.00 | 25.00 | 26.00 | 25.50 | 22.00 | 23.00 | 21.50 | ... | 22.00 | 18.50 | ... | 13.50 | ... | ... | |
| No. 2 timothy | 29.50 | 20.00 | 24.00 | 24.50 | 24.50 | 20.00 | 20.00 | 19.50 | 18.50 | 20.00 | 18.00 | ... | 12.50 | ... | ... | |
| No. 1 light clover, mixed | 29.50 | 19.00 | 25.00 | 26.00 | 24.50 | ... | 22.00 | 20.00 | 18.50 | [3]21.00 | 18.00 | ... | [2]13.50 | ... | ... | |
| No. 1 clover, mixed | ... | ... | 24.00 | ... | ... | ... | 20.00 | 21.00 | 17.00 | [2]17.00 | [2]17.50 | ... | 11.00 | ... | ... | |
| No. 1 clover | ... | ... | 24.00 | ... | ... | ... | 21.00 | 20.00 | 20.00 | 17.00 | [2]17.00 | ... | [2]11.50 | ... | ... | |
| Alfalfa: | ||||||||||||||||
| No. 1 alfalfa | 28.00 | ... | ... | 29.00 | 28.50 | 23.00 | 22.00 | ... | [2]21.00 | 22.00 | [2]21.00 | 15.50 | 18.00 | 18.00 | 19.00 | |
| Standard alfalfa | ... | ... | ... | 27.00 | ... | 20.00 | 20.00 | ... | [2]19.00 | 20.00 | [2]19.00 | 13.50 | 15.00 | 17.00 | ... | |
| No. 2 alfalfa | ... | ... | ... | 25.00 | ... | 17.00 | 18.00 | ... | [2]17.00 | 17.00 | [2]17.00 | 10.50 | 12.00 | 13.00 | ... | |
| Prairie: | ||||||||||||||||
| No. 1 upland | ... | ... | ... | ... | ... | ... | 17.00 | ... | ... | 17.00 | 16.50 | 11.00 | 12.00 | ... | ... | |
| No. 2 upland | ... | ... | ... | ... | ... | ... | 15.00 | ... | ... | 15.00 | 14.00 | 9.50 | 10.00 | ... | ... | |
| No. 1 midland | ... | ... | ... | ... | ... | ... | ... | ... | ... | 14.00 | 12.00 | 10.00 | 8.50 | ... | ... | |
| Grain: | ||||||||||||||||
| No. 1 wheat | ... | ... | ... | ... | ... | ... | ... | ... | ... | ... | ... | ... | ... | 20.00 | ... | |
| No. 1 oat | ... | ... | ... | ... | ... | ... | ... | ... | ... | ... | ... | ... | ... | 16.00 | 21.00 | |
| FEED (bagged). | ||||||||||||||||
| Wheat bran: | ||||||||||||||||
| Spring | 21.25 | 20.75 | 21.50 | 22.00 | ... | ... | ... | 19.50 | 17.00 | 15.25 | 12.50 | ... | ... | ... | ... | |
| Soft winter | 21.50 | 22.50 | 25.00 | 22.00 | 23.50 | 16.00 | 14.50 | 20.50 | 17.50 | ... | ... | ... | 10.75 | 28.00 | 28.00 | |
| Hard winter | 21.50 | 21.25 | ... | 22.00 | ... | ... | 14.00 | 20.00 | 17.00 | 15.25 | ... | 10.50 | 10.50 | ... | 22.00 | |
| Wheat middlings: | ||||||||||||||||
| Spring (standard) | 22.25 | 21.75 | 24.00 | 27.00 | ... | ... | ... | 21.50 | 20.50 | 16.50 | 13.50 | ... | ... | ... | ... | |
| Soft winter | ... | 28.00 | ... | 30.00 | 30.00 | ... | 22.50 | 27.50 | 24.00 | ... | ... | ... | 18.50 | 39.00 | ... | |
| Hard winter | ... | 27.00 | ... | 28.00 | ... | ... | 21.50 | 27.50 | 20.50 | ... | ... | ... | 18.50 | ... | ... | |
| Hard winter wheat shorts | ... | ... | ... | 30.00 | ... | 24.00 | 18.00 | 27.00 | ... | ... | ... | 18.00 | [3]15.50 | ... | ... | |
| Wheat millrun | ... | 23.50 | ... | ... | ... | ... | ... | 23.50 | ... | ... | 30.00 | ... | 15.00 | 27.00 | ... | |
| Rye middlings | ... | 20.50 | 21.00 | ... | ... | ... | ... | 19.00 | 17.00 | ... | 12.50 | 12.00 | ... | ... | ... | |
| High-protein meals: | ||||||||||||||||
| Linseed | 46.75 | 44.50 | ... | ... | ... | ... | 40.75 | [2]45.00 | 45.00 | 41.00 | 38.00 | 41.50 | 39.25 | ... | ... | |
| Cottonseed (41%) | ... | 45.25 | ... | ... | ... | 36.00 | 40.00 | 44.50 | 41.25 | 42.00 | ... | ... | 39.75 | 41.00 | ... | |
| Cottonseed (36%) | 45.25 | 43.25 | ... | 41.00 | 40.50 | 35.00 | 38.50 | 42.00 | 38.50 | 40.00 | ... | ... | ... | ... | 36.00 | |
| No. 1 alfalfa meal (medium) | ... | ... | ... | 29.00 | ... | 22.50 | 20.00 | ... | 23.50 | 21.50 | ... | 17.00 | 17.25 | 20.00 | 27.00 | |
| Gluten feed | 35.34 | 34.93 | ... | ... | ... | ... | 29.25 | ... | 32.45 | 28.65 | ... | ... | 34.50 | ... | ... | |
| White hominy feed | 29.25 | 28.75 | 30.00 | 28.00 | ... | ... | 21.00 | ... | 26.00 | 21.00 | ... | 19.00 | 20.00 | ... | ... | |
| Yellow hominy feed | 27.25 | 26.00 | 30.00 | ... | ... | ... | 19.00 | ... | 26.00 | 19.00 | ... | 18.50 | 19.00 | ... | ... | |
| Ground barley | ... | ... | ... | ... | ... | ... | ... | ... | 36.00 | 31.00 | 20.00 | ... | 24.50 | ... | [4]30.00 | |
| Dried beet pulp | 29.25 | 28.00 | ... | 33.50 | 42.00 | ... | ... | 25.80 | 25.90 | ... | 23.50 | ... | 21.00 | ... | 25.00 | |
[1] Hay quotations represent average of cash sales at these markets.
[2] Nominal.
[3] Brown.
[4] Rolled.
| Commodity. | New York. [1] |
Phila- del- phia. |
Rich- mond. |
At- lanta. |
Sa- van- nah. |
Mem- phis. [1] |
St. Louis. [1] |
Pitts- burgh. [1] |
|---|---|---|---|---|---|---|---|---|
| HAY. | ||||||||
| Timothy and clover: | ||||||||
| No. 1 timothy | 31.00 | 23.00 | 26.00 | 28.00 | 26.50 | 24.50 | 25.00 | 22.50 |
| Standard timothy | 30.50 | 22.00 | 25.00 | 26.00 | 25.50 | 22.00 | 23.00 | 21.50 |
| No. 2 timothy | 29.50 | 20.00 | 24.00 | 24.50 | 24.50 | 20.00 | 20.00 | 19.50 |
| No. 1 light clover, mixed | 29.50 | 19.00 | 25.00 | 26.00 | 24.50 | ... | 22.00 | 20.00 |
| No. 1 clover, mixed | ... | ... | 24.00 | ... | ... | ... | 20.00 | 21.00 |
| No. 1 clover | ... | ... | 24.00 | ... | ... | ... | 21.00 | 20.00 |
| Alfalfa: | ||||||||
| No. 1 alfalfa | 28.00 | ... | ... | 29.00 | 28.50 | 23.00 | 22.00 | ... |
| Standard alfalfa | ... | ... | ... | 27.00 | ... | 20.00 | 20.00 | ... |
| No. 2 alfalfa | ... | ... | ... | 25.00 | ... | 17.00 | 18.00 | ... |
| Prairie: | ||||||||
| No. 1 upland | ... | ... | ... | ... | ... | ... | 17.00 | ... |
| No. 2 upland | ... | ... | ... | ... | ... | ... | 15.00 | ... |
| No. 1 midland | ... | ... | ... | ... | ... | ... | ... | ... |
| Grain: | ||||||||
| No. 1 wheat | ... | ... | ... | ... | ... | ... | ... | ... |
| No. 1 oat | ... | ... | ... | ... | ... | ... | ... | ... |
| FEED (bagged). | ||||||||
| Wheat bran: | ||||||||
| Spring | 21.25 | 20.75 | 21.50 | 22.00 | ... | ... | ... | 19.50 |
| Soft winter | 21.50 | 22.50 | 25.00 | 22.00 | 23.50 | 16.00 | 14.50 | 20.50 |
| Hard winter | 21.50 | 21.25 | ... | 22.00 | ... | ... | 14.00 | 20.00 |
| Wheat middlings: | ||||||||
| Spring (standard) | 22.25 | 21.75 | 24.00 | 27.00 | ... | ... | ... | 21.50 |
| Soft winter | ... | 28.00 | ... | 30.00 | 30.00 | ... | 22.50 | 27.50 |
| Hard winter | ... | 27.00 | ... | 28.00 | ... | ... | 21.50 | 27.50 |
| Hard winter wheat shorts | ... | ... | ... | 30.00 | ... | 24.00 | 18.00 | 27.00 |
| Wheat millrun | ... | 23.50 | ... | ... | ... | ... | ... | 23.50 |
| Rye middlings | ... | 20.50 | 21.00 | ... | ... | ... | ... | 19.00 |
| High-protein meals: | ||||||||
| Linseed | 46.75 | 44.50 | ... | ... | ... | ... | 40.75 | [2]45.00 |
| Cottonseed (41%) | ... | 45.25 | ... | ... | ... | 36.00 | 40.00 | 44.50 |
| Cottonseed (36%) | 45.25 | 43.25 | ... | 41.00 | 40.50 | 35.00 | 38.50 | 42.00 |
| No. 1 alfalfa meal (medium) | ... | ... | ... | 29.00 | ... | 22.50 | 20.00 | ... |
| Gluten feed | 35.34 | 34.93 | ... | ... | ... | ... | 29.25 | ... |
| White hominy feed | 29.25 | 28.75 | 30.00 | 28.00 | ... | ... | 21.00 | ... |
| Yellow hominy feed | 27.25 | 26.00 | 30.00 | ... | ... | ... | 19.00 | ... |
| Ground barley | ... | ... | ... | ... | ... | ... | ... | ... |
| Dried beet pulp | 29.25 | 28.00 | ... | 33.50 | 42.00 | ... | ... | 25.80 |
| Commodity. | Cin- cinnati. [1] |
Chi- cago. [1] |
Min- nea- polis. [1] |
Omaha. [1] |
Kan- sas City. [1] |
San Fran- cisco. [1] |
Los Angeles. [1] |
|---|---|---|---|---|---|---|---|
| HAY. | |||||||
| Timothy and clover: | |||||||
| No. 1 timothy | 20.00 | 24.00 | 19.50 | ... | [2]14.50 | ... | ... |
| Standard timothy | ... | 22.00 | 18.50 | ... | 13.50 | ... | ... |
| No. 2 timothy | 18.50 | 20.00 | 18.00 | ... | 12.50 | ... | ... |
| No. 1 light clover, mixed | 18.50 | [3]21.00 | 18.00 | ... | [2]13.50 | ... | ... |
| No. 1 clover, mixed | 17.00 | [2]17.00 | [2]17.50 | ... | 11.00 | ... | ... |
| No. 1 clover | 20.00 | 17.00 | [2]17.00 | ... | [2]11.50 | ... | ... |
| Alfalfa: | |||||||
| No. 1 alfalfa | [2]21.00 | 22.00 | [2]21.00 | 15.50 | 18.00 | 18.00 | 19.00 |
| Standard alfalfa | [2]19.00 | 20.00 | [2]19.00 | 13.50 | 15.00 | 17.00 | ... |
| No. 2 alfalfa | [2]17.00 | 17.00 | [2]17.00 | 10.50 | 12.00 | 13.00 | ... |
| Prairie: | |||||||
| No. 1 upland | ... | 17.00 | 16.50 | 11.00 | 12.00 | ... | ... |
| No. 2 upland | ... | 15.00 | 14.00 | 9.50 | 10.00 | ... | ... |
| No. 1 midland | ... | 14.00 | 12.00 | 10.00 | 8.50 | ... | ... |
| Grain: | |||||||
| No. 1 wheat | ... | ... | ... | ... | ... | 20.00 | ... |
| No. 1 oat | ... | ... | ... | ... | ... | 16.00 | 21.00 |
| FEED (bagged). | |||||||
| Wheat bran: | |||||||
| Spring | 17.00 | 15.25 | 12.50 | ... | ... | ... | ... |
| Soft winter | 17.50 | ... | ... | ... | 10.75 | 28.00 | 28.00 |
| Hard winter | 17.00 | 15.25 | ... | 10.50 | 10.50 | ... | 22.00 |
| Wheat middlings: | |||||||
| Spring (standard) | 20.50 | 16.50 | 13.50 | ... | ... | ... | ... |
| Soft winter | 24.00 | ... | ... | ... | 18.50 | 39.00 | ... |
| Hard winter | 20.50 | ... | ... | ... | 18.50 | ... | ... |
| Hard winter wheat shorts | ... | ... | ... | 18.00 | [3]15.50 | ... | ... |
| Wheat millrun | ... | ... | 30.00 | ... | 15.00 | 27.00 | ... |
| Rye middlings | 17.00 | ... | 12.50 | 12.00 | ... | ... | ... |
| High-protein meals: | |||||||
| Linseed | 45.00 | 41.00 | 38.00 | 41.50 | 39.25 | ... | ... |
| Cottonseed (41%) | 41.25 | 42.00 | ... | ... | 39.75 | 41.00 | ... |
| Cottonseed (36%) | 38.50 | 40.00 | ... | ... | ... | ... | 36.00 |
| No. 1 alfalfa meal (medium) | 23.50 | 21.50 | ... | 17.00 | 17.25 | 20.00 | 27.00 |
| Gluten feed | 32.45 | 28.65 | ... | ... | 34.50 | ... | ... |
| White hominy feed | 26.00 | 21.00 | ... | 19.00 | 20.00 | ... | ... |
| Yellow hominy feed | 26.00 | 19.00 | ... | 18.50 | 19.00 | ... | ... |
| Ground barley | 36.00 | 31.00 | 20.00 | ... | 24.50 | ... | [4]30.00 |
| Dried beet pulp | 25.90 | ... | 23.50 | ... | 21.00 | ... | 25.00 |
[1] Hay quotations represent average of cash sales at these markets.
[2] Nominal.
[3] Brown.
[4] Rolled.
Middlings were more active than bran and in several western markets, including Kansas City and St. Louis, there was a good demand for middlings and shorts from both local buyers and shippers. The shipping demand was rather broad, mostly in single car orders, from the Central West, South, and Southeast. The higher prices asked for middlings in the southern markets, however, are causing consumers to buy bran instead. Although prices are low some dealers are inclined to think that still lower prices will prevail if an attempt is made to market the feed stored at lake ports before navigation closes. However, Minneapolis mills are holding firm at present quotations.
Cottonseed meal.—The cottonseed meal market has lost much of the strength displayed during the past few weeks. New seed is now moving to mills in larger quantities and the available supply of meal is increasing. There is practically no consumptive demand and dealers are therefore holding off buying as they expect lower prices. Offerings from mills are still limited and in some sections only for October delivery. Lack of demand rather than heavy offerings is probably the cause of the present weakness in meal prices. Some exports of meal are reported at New Orleans. The demand for meal for fertilizer purposes is light because other ammoniates are cheaper at the present time.
Linseed meal.—Northwestern linseed meal mills reduced their prices somewhat during the week, but the decline was not reflected in all the markets. Philadelphia reports a slight advance in prices, but quotations at Buffalo and Chicago were lower. Stocks are rather heavy and jobbers are pressing sales. There is only a very light demand and resellers are offering meal at $2 to $3 under mill prices in an effort to stimulate sales.
Gluten feed.—No further reductions in the price of gluten feed were reported during the week, but the demand was very dull and very little interest was shown by buyers. Large Chicago manufacturers reported a slight increase in buying orders toward the last of the week. Buffalo reported a light demand, but mills are not pressing sales as they were a few days ago.
Hominy feed.—Lower corn prices were reflected in the hominy feed market. Prices declined 50¢ to $1 in several markets and mills were urgent sellers. The demand for all other feeds is very light so that a surplus in the offerings, especially of yellow hominy feed, is noticeable.
Alfalfa meal.—Alfalfa meal at Kansas City was weak and lower, No. 1 meal being offered as low as $17.20 per ton and No. 2 at $14. The demand from both feeders and feed manufacturers is light. But little improvement in the market for this feed can be expected until some activity appears in the demand for other feeds.
Peanut meal.—No offerings of new crop peanut meal have been reported, and it is stated that probably none will be offered until about Nov. 1.
The demand for cut, or chopped, hay has diminished to such an extent during the past decade that at present only an occasional car is bought by city dealers while only a few shippers prepare this commodity for market.
But back in the days when phaetons, surreys, and smart traps drawn by high-stepping trotters and easy-going “family” horses were seen upon the boulevards, and the heavy hauling was done by big draft horses rather than by gasoline-eating trucks, many city dealers operated plants for the preparation and baling of cut hay. Numerous plants also were situated in the producing sections of New York, Pennsylvania, and Ohio. The advent of the automobile, however, has changed all this, aided materially by the substitution of electricity for mule power as the propelling force of street cars.
The kinds of hay usually chopped were timothy and clover mixed. While hay which had become slightly overripe or which contained a mixture of grasses frequently was used, only good, sound, and sweet feeding hay was considered fit for shipping.
Cut hay is generally fed mixed with grain and is considered an excellent feed, as it prevents the stock from eating the concentrated grain ration too rapidly. The hay is usually dampened when used in this manner. This is one of the disadvantages of feeding it for if more than enough is mixed for one feed and it is not fed within a short time it is likely to sour if the weather is warm, or possibly freeze if the weather is cold. This condition, together with the labor and bother of mixing, has caused feeders in many instances to turn to ready-mixed and molasses feeds.
However, for feeders who desire to prepare their own mixed feed ration the cut hay is probably the most convenient ingredient that can be used to produce the required bulk.
The Seed Laboratory of the Bureau of Plant Industry reports the following imports of forage-plant seeds permitted entry into the United States under the seed importation Act.
| Kind of seed. | September— | July 1- Sept. 30, 1921 |
July 1- Sept. 30, 1920 |
|
|---|---|---|---|---|
| 1921 | 1920 | |||
| Pounds. | Pounds. | Pounds. | Pounds. | |
| Alfalfa | 422,200 | 44,100 | 1,364,000 | 171,500 |
| Canada bluegrass | 5,200 | ... | 7,400 | ... |
| Alsike clover | 671,400 | 87,000 | 1,106,700 | 109,700 |
| Crimson clover | 879,500 | 998,100 | 1,581,600 | 1,958,800 |
| Red clover | 116,400 | 6,800 | 1,792,900 | 305,200 |
| White clover | 263,600 | ... | 538,600 | ... |
| White and alsike clover mixtures | 2,700 | ... | 8,100 | ... |
| Red and alsike clover mixtures | 2,100 | ... | 2,100 | ... |
| Alsike clover and timothy mixtures | 500 | ... | 1,100 | ... |
| Broom-corn millet | ... | ... | ... | 1,100 |
| Foxtail millet | ... | 14,700 | ... | 14,700 |
| Grass mixtures | ... | ... | 40,100 | ... |
| Orchard grass | 833,300 | ... | 959,100 | ... |
| Rape | 554,100 | 170,900 | 728,700 | 215,700 |
| English rye grass | ... | 15,600 | 16,300 | 130,800 |
| Italian rye grass | ... | 49,800 | 13,800 | 131,300 |
| Timothy | ... | ... | 95,100 | ... |
| Hairy vetch | 280,600 | 33,000 | 645,900 | 367,700 |
| Spring vetch | ... | ... | 8,800 | ... |
The cleaning, if any, that the average farmer gives his seed merely removes dirt, chaff, and weed and other foreign seeds that are much larger or smaller or much heavier or lighter than the kind of seed that is being cleaned.

Perhaps the main feature in the cotton markets for the week ending Oct. 1 was the sensational advance in prices which occurred on Sept. 27. That day was the first day for the issuance of notices of deliveries to be made on October future contracts at the two future exchanges and it is reported that the notices issued were for more than 80,000 bales at New York and over 20,000 bales at New Orleans. However, in spite of these notices of heavy deliveries, the demand for October contracts during the day was such that the price at New York rose 13⁄4¢ per lb. and at New Orleans nearly 11⁄2¢ over the low point reached early in the morning.
The closing prices for October future contracts for that day were 21.03¢ at New York and 20.70¢ at New Orleans, or 143 points and 135 points, respectively, above the closing prices of the previous Saturday. The average price of middling in the 10 designated markets reached 20.89¢ per lb. on Sept. 27, or very nearly $5 per bale higher than at the close of the previous week.
Only the better grades of cotton are deliverable on future contracts so that probably one of the main causes of the keen demand for October contracts was the apprehension that the present crop will not only be the smallest for many years but that it will also be of low grade, as is indicated by reports from some sections.
During the remainder of the week prices eased off somewhat under heavy hedge selling and liquidation by long interests, but indications were that the demand for future contracts, as well as for spot cotton during the entire week, was fully equal to the offerings. The end of the week found prices higher than those prevailing at the close of the previous week except for the prices for the more distant months, which were a few points lower.
The average price of Middling as determined from the quotations of the 10 designated spot markets closed at 20.71¢ per lb. on Oct. 1, compared with 19.92¢ at the close of the previous week and 23.11¢ for the corresponding day in 1920.
Fluctuations in prices for futures ranged from a decline of 27 points for July future contracts at New York to an advance of 88 points for October futures in the same market. October futures on the New Orleans Cotton Exchange advanced 70 points. October future contracts on the Liverpool Cotton Association closed at 14.68d. per lb. on Sept. 30, compared with 14.16d. at the close of the previous week and 17.23d. for the corresponding day in 1920.
Spot sales during the week at the 10 designated markets were much larger than they have been for any week this season. They amounted to 209,938 bales, compared with 155,954 the previous week and 96,095 bales for the corresponding week in 1920. On Sept. 28 the sales in the 10 markets were 59,929 bales, the largest single day’s sales for this season. The previous largest day’s sales for the season, involving 38,504 bales, occurred on Sept. 6. The total sales in the 10 designated markets from Aug. 1 to Oct. 1 were 980,146 bales, compared with 503,135 for the corresponding period last year. (Sales for 1920 exclude Dallas.)
SPOT COTTON QUOTATIONS.
Price of Middling spot cotton for Oct. 1, and the commercial differences in price between Middling and other grades of American Upland cotton at each of the 10 markets named, together with the total number of bales sold during the week ending Oct. 1, in each of the markets, as reported to the Bureau of Markets and Crop Estimates.
| Nor- folk. |
Au- gus- ta. |
Sa- van- nah. |
Mont- gom- ery. |
Mem- phis. |
Little Rock. |
Dal- las. |
Hous- ton. |
Gal- ves- ton. |
New Or- leans. |
Aver- age. |
||
|---|---|---|---|---|---|---|---|---|---|---|---|---|
| White standards: | On.[1] | On. | On. | On. | On. | On. | On. | On. | On. | On. | On. | |
| Middling Fair | 200 | 250 | 175 | 200 | 200 | 225 | 200 | 225 | 300 | 175 | 215 | |
| Strict Good Middling | 150 | 200 | 150 | 150 | 150 | 175 | 150 | 175 | 300 | 150 | 165 | |
| Good Middling | 100 | 100 | 100 | 100 | 100 | 100 | 100 | 125 | 100 | 100 | 103 | |
| Strict Middling | 50 | 50 | 50 | 50 | 50 | 50 | 50 | 75 | 50 | 50 | 53 | |
| Middling | 20.25 | 20.25 | 20.75 | 20.00 | 21.00 | 20.75 | 20.60 | 21.25 | 21.75 | 20.50 | 20.71 | |
| Off.[1] | Off. | Off. | Off. | Off. | Off. | Off. | Off. | Off. | Off. | Off. | ||
| Strict Low Middling | 75 | 75 | 75 | 100 | 100 | 75 | 100 | 100 | 100 | 75 | 88 | |
| Low Middling | 200 | 200 | 200 | 200 | 250 | 200 | 225 | 200 | 250 | 200 | 213 | |
| Strict Good Ordinary[2] | 300 | 300 | 300 | 300 | 400 | 300 | 325 | 300 | 400 | 450 | 338 | |
| Good Ordinary[2] | 400 | 425 | 400 | 400 | 500 | 400 | 425 | 400 | 500 | 550 | 440 | |
| Yellow Tinged: | ||||||||||||
| Good Middling | 50 | Even. | 50 | 50 | 50 | 50 | 50 | 50 | 50 | 50 | 45 | |
| Strict Middling | 125 | 100 | 150 | 150 | 150 | 125 | 150 | 150 | 150 | 100 | 135 | |
| Middling[2] | 200 | 200 | 250 | 250 | 200 | 225 | 250 | 250 | 250 | 250 | 233 | |
| Strict Low Middling[2] | 350 | 300 | 350 | 350 | 350 | 325 | 350 | 400 | 350 | 325 | 345 | |
| Low Middling[2] | 450 | 400 | 450 | 450 | 450 | 425 | 450 | 500 | 500 | 400 | 448 | |
| Yellow Stained: | ||||||||||||
| Good Middling | 200 | 175 | 200 | 225 | 200 | 200 | 200 | 250 | 250 | 300 | 220 | |
| Strict Middling[2] | 300 | 275 | 300 | 325 | 300 | 250 | 300 | 350 | 350 | 350 | 310 | |
| Middling[2] | 450 | 450 | 400 | 450 | 350 | 400 | 400 | 400 | 450 | 400 | 415 | |
| Blue Stained: | ||||||||||||
| Good Middling[2] | 250 | 225 | 250 | 275 | 200 | 250 | 300 | 300 | 300 | 325 | 268 | |
| Strict Middling[2] | 350 | 325 | 350 | 375 | 300 | 350 | 350 | 400 | 400 | 375 | 358 | |
| Middling[2] | 450 | 425 | 450 | 500 | 350 | 450 | 450 | 500 | 500 | 425 | 450 | |
| Sales for week, bales | 10,205 | 2,376 | 3,160 | 3,227 | 25,450 | 11,851 | 68,007 | 58,387 | 8,681 | 18,594 | [3]209,938 | |
[1] The differences are stated in terms of hundredths of a cent per pound. By “On” is meant that the stated number of points is to be added to the price of Middling and by “Off” is meant that the stated number of points is to be subtracted from the price of Middling.
[2] These grades are not tenderable on future contracts made subject to section 5 of the United States cotton futures Act, as amended, on the future exchanges at New York and New Orleans.
[3] Total sales in the designated markets.
Commercial reports indicate that trading in cotton goods has broadened and that, while the demand for goods in small quantities and under frequent orders is rather active, there is still uncertainty as to the effect of higher prices on the consumption of goods.
The crop reporting board of the Bureau of Markets and Crop Estimates on Oct. 3. 1921, estimated that the condition of the cotton crop on Sept. 25 was 42.2% of normal, compared with 49.3% on Aug. 25, 59.1% on Sept. 25, 1920, 54.4% on Sept. 25, 1919, and 62.4% the average on Sept. 25 of the past 10 years.
A condition of 42.2% on Sept. 25 forecasts a yield per acre of about 118 lbs. and a total production of about 6,537,000 bales of 500 lbs., gross. In 1920 the production was 13,439,603 bales; in 1919, 11,420,763; in 1918, 12,040,532; in 1917, 11,302,375; and in 1916, 11,449,930 bales.
The condition of the crop on Sept. 25 is the lowest on record and the estimated production is less than that for any year since 1884 when 5,682,000 bales were produced.
The preliminary report of the Bureau of the Census issued on Oct. 3, showed 2,907,950 bales ginned prior to Sept. 25, compared with 2,249,606 bales for the corresponding period last year and 1,835,214 bales for 1919. The figure for 1921 is subject to slight corrections when checked with individual returns of the ginners being transmitted by mail.
Closing Future Prices for Oct. 1 and for the Corresponding Days in 1920 and 1919.
| Month. | New York. | New Orleans. | ||||
|---|---|---|---|---|---|---|
| 1921 | 1920 | 1919 | 1921 | 1920 | 1919 | |
| October | 20.48 | 22.25 | 30.55 | 20.05 | 20.80 | 31.25 |
| December | 20.65 | 21.25 | 30.84 | 20.26 | 20.42 | 30.85 |
| January | 20.33 | 20.92 | 30.85 | 20.03 | 20.25 | 30.76 |
| March | 20.02 | 20.68 | 31.00 | 19.59 | 20.25 | 30.72 |
Inspected cotton, Government-classed, in warehouses at the ports of New York and New Orleans on Sept. 30, and on the corresponding day in 1920, of the grades tenderable on future contracts made on the exchanges in these markets subject to section 5 of the United States cotton futures Act as amended:
| Grade. | New York. | New Orleans. | ||
|---|---|---|---|---|
| 1921 | 1920 | 1921 | 1920 | |
| Bales. | Bales. | Bales. | Bales. | |
| Middling Fair | ... | ... | 3 | 2 |
| Strict Good Middling | 234 | 3 | 293 | 95 |
| Good Middling | 4,393 | 24 | 3,645 | 726 |
| Strict Middling | 19,482 | 38 | 22,654 | 1,652 |
| Middling | 47,667 | 179 | 37,173 | 1,538 |
| Strict Low Middling | 39,264 | 3,079 | 19,040 | 1,264 |
| Low Middling | 9,443 | 1,294 | 7,410 | 409 |
| Good Middling Yellow Tinged | 3,880 | 136 | 3,214 | 71 |
| Strict Middling Yellow Tinged | 3,405 | 453 | 3,046 | 113 |
| Good Middling Yellow Stained | 23 | 2 | 3 | 2 |
| Total | 127,791 | 5,208 | 96,481 | 5,872 |
Total stocks of cotton, all kinds, on Sept. 30. at the port of New York were 147,822 bales and for the corresponding day in 1920, 25,594 bales; at the port of New Orleans, 426,488 bales, and for the corresponding day in 1920, 206,460 bales.
Cotton Movement and Exports from Aug. 1 to Sept. 30.
[Information from commercial sources.]
| 1921 | 1920 | |
|---|---|---|
| Bales. | Bales. | |
| Port receipts | 1,032,400 | 630,734 |
| Port stocks | 1,407,344 | 816,826 |
| Interior receipts | 1,292,150 | 736,239 |
| Interior stocks | 1,147,941 | 920,155 |
| Into sight | 1,852,353 | 1,369,128 |
| Northern spinners’ takings | 296,661 | 206,321 |
| Southern spinners’ takings | 497,115 | 328,213 |
| World’s visible supply of American cotton | 3,944,690 | 2,763,568 |
Exports for the week ending Sept. 30, amounted to 147,591 bales, compared with 86,204 bales the previous week and 109,498 bales for the corresponding week in 1920. The total exports from Aug. 1 to Sept. 30 were 870,698 bales, compared with 457,750 bales in 1920.
Exports of American Cotton from Aug. 1 to Sept. 30.
| To— | 1921 | 1920 |
|---|---|---|
| Bales. | Bales. | |
| Great Britain | 118,751 | 177,162 |
| France | 145,343 | 92,617 |
| Germany | 248,728 | 110,275 |
| Italy | 32,515 | 26,025 |
| Japan and China | 211,103 | 1,526 |
| Other countries | 114,258 | 50,145 |
| Total | 870,698 | 457,750 |
A fair demand for premium staple cotton is reported at New Orleans and a good demand at Memphis. Some of the sales in these two markets during the week were as follows:
| New Orleans: | Cents. | |
| Strict Middling, 11⁄16 ins. | 22 | |
| Middling, 11⁄16 ins. | 22 | |
| Middling to Strict Middling, 11⁄16 ins. | 22 | 1⁄2 |
| Strict Good Ordinary, California, 11⁄16 ins. | 17 | |
| Middling, 11⁄16 to 11⁄8 ins. | 23 | |
| Middling to Strict Middling, 11⁄8 ins. | 27 | 3⁄4 |
| Strict Low Middling to Middling, 11⁄8 ins. | 21 | |
| Good Middling, 11⁄8 ins. | 30 | |
| Good Middling, 11⁄4 ins. | 36 | |
| Strict Low Middling to Middling, 15⁄16 ins. | 36 | |
| Middling to Strict Middling, 13⁄16 ins. | 35 | |
| Strict Middling, full 13⁄16 ins. | 36 | |
| Strict Good Ordinary to Low Middling, 13⁄16 ins. | 22 | |
| Memphis: | ||
| Strict Middling, 11⁄8 ins. | 30 | |
| Middling, 11⁄8 to 13⁄16 ins. | 32 | |
| Strict Middling to Good Middling, full 13⁄16 ins. | 37 | 1⁄2 |
| Middling to Strict Middling, 13⁄16 ins. | 34 | |
| Middling to Strict Middling, full 13⁄16 ins. | 37 | |
| Middling, full 13⁄16 to 11⁄4 ins. | 39 | |
| Strict Middling to Good Middling, 13⁄16 to 11⁄4 ins. | 40 | |
| Strict Middling, 15⁄16 to 13⁄8 ins. | 40 | |
| Middling, 13⁄8 ins. | 41 | |
The average premiums quoted in the New Orleans and Memphis markets for the staple lengths specified are stated below for Middling cotton based on Middling short staple cotton at 201⁄2¢ per lb. at New Orleans and 21¢ at Memphis on Oct. 1, 1921, and 23¢ per lb. at New Orleans and 25¢ at Memphis on Oct. 2, 1920.
| Length. | New Orleans. |
Memphis. | ||
|---|---|---|---|---|
| 1921 | 1920 | 1921 | 1920 | |
| Points. | Points. | Points. | Points. | |
| 11⁄16 ins. | 175 | 400 | 200 | 65 |
| 11⁄8 ins. | 750 | ... | 700 | 700 |
| 13⁄16 ins. | 1,100 | ... | 1,200 | 1,800 |
| 11⁄4 ins. | 1,500 | ... | 1,900 | ... |
The latest quotations received for Pima American-Egyptian cotton are 40¢ per lb. for No. 2 grade and 37¢ for No. 3 grade f. o. b. New England mill points.
Telegraphic advices indicate that Egyptian Sakellaridis cotton for prompt shipment is quoted at 637⁄8¢ per lb. for the grade Fully Good and 495⁄8¢ for the grade Good Fair on c. i. f. terms landed at Boston or New York.
COTTONSEED PRICE QUOTATIONS.
Week Ending Sept. 24.
| City. | Car lots. | Wagon lots. |
|---|---|---|
| Per ton. | Per ton. | |
| Charlotte, N. C. | $43.00 | $40.00 |
| Cheraw, S. C. | 46.25 | 38.50 |
| Edgefield, S. C. | 42.00 | 40.00 |
| Greenville, S. C. | ... | 38.00 |
| Orangeburg, S. C. | 45.00 | 42.00 |
| Lauratown, Ark. | 38.00 | ... |
| Ashdown, Ark. | ... | 32.00 |
| Jonesboro, Ark. | ... | 32.00 |
| Prescott, Ark. | ... | 35.00 |
| Henning, Tenn. | ... | 35.00 |
| New Orleans, La. | 40.00 | ... |
| Atlanta, Ga. | 45.00 | 42.00 |
| Dallas, Tex. | 41.00-42.00 | 37.00-38.00 |
| Fort Worth, Tex. | 40.00 | ... |
| Houston, Tex. | 40.00 | ... |
| Oklahoma City, Okla. | 35.00 | 30.00 |
| Guthrie, Okla. | 35.00 | 24.00 |
| Chickasha, Okla. | 34.00 | 28.00 |
Imports of wool through the port of Philadelphia during the two weeks ending Oct. 1 totaled 2,842 bales, weighing 1,203,247 lbs., valued at $129,462. Imports at Boston during the same period totaled 802 bales, weighing 330,551 lbs., and having a valuation of $42,821. In addition, 128 bales of mohair, weighing 64,694 lbs., valued at $9,375, were received at Boston.
WOOL CONSUMPTION REPORT FOR AUGUST.
Quantities Entering into Manufacture According to Condition, Classes, and Grades.
[In thousands of pounds; i. e., 000 omitted.]
| Class and grade. |
Grease. | Scoured. | Pulled. | Total, August. |
Total, July. |
Total, January to August. |
||||||||
|---|---|---|---|---|---|---|---|---|---|---|---|---|---|---|
| 1921 | 1920 | 1921 | 1920 | 1921 | 1920 | 1921 | 1920 | 1921 | 1920 | 1921 | 1920 | |||
| Fine: | ||||||||||||||
| Combing— | ||||||||||||||
| Domestic | 6,241 | 2,090 | 45 | 56 | 19 | 45 | 6,305 | 2,191 | 4,166 | 2,411 | 27,035 | 40,533 | ||
| Foreign | 2,814 | 4,661 | 14 | 56 | 1 | 10 | 2,829 | 4,727 | 2,976 | 5,701 | 28,138 | 53,343 | ||
| Clothing— | ||||||||||||||
| Domestic | 985 | 358 | 654 | 476 | 229 | 54 | 1,868 | 888 | 1,624 | 773 | 11,720 | 12,322 | ||
| Foreign | 270 | 487 | 632 | 546 | 10 | 7 | 912 | 1,040 | 959 | 899 | 8,101 | 13,164 | ||
| 1⁄2 blood: | ||||||||||||||
| Combing— | ||||||||||||||
| Domestic | 4,280 | 1,937 | 45 | 52 | 138 | 219 | 4,463 | 2,208 | 3,678 | 2,517 | 24,681 | 27,949 | ||
| Foreign | 1,285 | 2,066 | 53 | 50 | ... | ... | 1,338 | 2,116 | 1,345 | 2,544 | 10,088 | 24,582 | ||
| Clothing— | ||||||||||||||
| Domestic | 347 | 195 | 561 | 345 | 215 | 45 | 1,123 | 585 | 925 | 523 | 7,315 | 10,661 | ||
| Foreign | 12 | 10 | 199 | 114 | 10 | 7 | 221 | 131 | 310 | 98 | 2,131 | 3,057 | ||
| 3⁄8 blood: | ||||||||||||||
| Combing— | ||||||||||||||
| Domestic | 2,207 | 1,323 | 299 | 148 | 185 | 106 | 2,691 | 1,577 | 2,741 | 1,514 | 20,485 | 29,035 | ||
| Foreign | 1,603 | 2,112 | 35 | 37 | ... | ... | 1,638 | 2,149 | 1,410 | 1,503 | 12,420 | 21,708 | ||
| Clothing— | ||||||||||||||
| Domestic | 183 | 71 | 1,019 | 434 | 443 | 64 | 1,645 | 569 | 1,580 | 828 | 11,630 | 12,180 | ||
| Foreign | 172 | 140 | 307 | 589 | ... | 1 | 479 | 730 | 348 | 257 | 2,948 | 5,236 | ||
| 1⁄4 blood: | ||||||||||||||
| Combing— | ||||||||||||||
| Domestic | 2,747 | 1,630 | 159 | 151 | 266 | 161 | 3,172 | 1,942 | 2,861 | 1,666 | 22,630 | 23,722 | ||
| Foreign | 2,719 | 3,329 | 109 | 143 | 61 | 32 | 2,889 | 3,504 | 2,424 | 3,829 | 28,920 | 37,667 | ||
| Clothing— | ||||||||||||||
| Domestic | 289 | 186 | 790 | 372 | 193 | 39 | 1,272 | 597 | 1,143 | 608 | 8,641 | 6,930 | ||
| Foreign | 504 | 314 | 443 | 243 | 33 | 19 | 980 | 576 | 966 | 608 | 7,106 | 6,561 | ||
| Low or Lincoln: | ||||||||||||||
| Combing— | ||||||||||||||
| Domestic | 158 | 223 | 9 | 36 | 2 | 2 | 169 | 261 | 156 | 199 | 1,386 | 1,742 | ||
| Foreign | 485 | 570 | 15 | 45 | 31 | 3 | 531 | 618 | 825 | 572 | 5,555 | 7,839 | ||
| Clothing— | ||||||||||||||
| Domestic | 4 | 13 | 105 | 45 | 10 | 7 | 119 | 65 | 117 | 61 | 1,074 | 709 | ||
| Foreign | 21 | 154 | 58 | 7 | 1 | 3 | 80 | 164 | 32 | 56 | 697 | 1,263 | ||
| Carpet: | ||||||||||||||
| Combing, foreign | 2,522 | 2,380 | 95 | 248 | 70 | 46 | 2,687 | 2,674 | 1,993 | 2,255 | 13,596 | 23,353 | ||
| Filling, foreign | 2,812 | 2,530 | 509 | 572 | 461 | 245 | 3,782 | 3,347 | 2,925 | 2,910 | 18,405 | 26,111 | ||
| Grade not stated: | ||||||||||||||
| Domestic | 5,513 | 97 | 103 | 58 | ... | ... | 5,616 | 155 | 5,838 | 20 | 38,550 | 730 | ||
| Foreign | 4,351 | 25 | 25 | 9 | ... | ... | 4,376 | 34 | 5,009 | 22 | 31,553 | 707 | ||
| Total: | ||||||||||||||
| Domestic | 22,954 | 8,123 | 3,789 | 2,173 | 1,700 | 742 | 28,443 | 11,038 | 24,829 | 11,120 | 175,147 | 166,513 | ||
| Foreign | 19,570 | 18,778 | 2,494 | 2,659 | 678 | 373 | 22,742 | 21,810 | 21,522 | 21,254 | 169,658 | 224,591 | ||
| Grand total, August | 42,524 | 26,901 | 6,283 | 4,832 | 2,378 | 1,115 | 51,185 | 32,848 | ... | ... | ... | ... | ||
| Grand total, July | 38,022 | 26,757 | 5,923 | 4,281 | 2,406 | 1,336 | ... | ... | 46,351 | 32,374 | ... | ... | ||
| Grand total, Jan. to Aug. | 283,721 | 321,703 | 43,430 | 56,099 | 17,654 | 13,302 | ... | ... | ... | ... | 344,805 | 391,101 | ||
| Class and grade. |
Grease. | Scoured. | Pulled. | |||||
|---|---|---|---|---|---|---|---|---|
| 1921 | 1920 | 1921 | 1920 | 1921 | 1920 | |||
| Fine: | ||||||||
| Combing— | ||||||||
| Domestic | 6,241 | 2,090 | 45 | 56 | 19 | 45 | ||
| Foreign | 2,814 | 4,661 | 14 | 56 | 1 | 10 | ||
| Clothing— | ||||||||
| Domestic | 985 | 358 | 654 | 476 | 229 | 54 | ||
| Foreign | 270 | 487 | 632 | 546 | 10 | 7 | ||
| 1⁄2 blood: | ||||||||
| Combing— | ||||||||
| Domestic | 4,280 | 1,937 | 45 | 52 | 138 | 219 | ||
| Foreign | 1,285 | 2,066 | 53 | 50 | ... | ... | ||
| Clothing— | ||||||||
| Domestic | 347 | 195 | 561 | 345 | 215 | 45 | ||
| Foreign | 12 | 10 | 199 | 114 | 10 | 7 | ||
| 3⁄8 blood: | ||||||||
| Combing— | ||||||||
| Domestic | 2,207 | 1,323 | 299 | 148 | 185 | 106 | ||
| Foreign | 1,603 | 2,112 | 35 | 37 | ... | ... | ||
| Clothing— | ||||||||
| Domestic | 183 | 71 | 1,019 | 434 | 443 | 64 | ||
| Foreign | 172 | 140 | 307 | 589 | ... | 1 | ||
| 1⁄4 blood: | ||||||||
| Combing— | ||||||||
| Domestic | 2,747 | 1,630 | 159 | 151 | 266 | 161 | ||
| Foreign | 2,719 | 3,329 | 109 | 143 | 61 | 32 | ||
| Clothing— | ||||||||
| Domestic | 289 | 186 | 790 | 372 | 193 | 39 | ||
| Foreign | 504 | 314 | 443 | 243 | 33 | 19 | ||
| Low or Lincoln: | ||||||||
| Combing— | ||||||||
| Domestic | 158 | 223 | 9 | 36 | 2 | 2 | ||
| Foreign | 485 | 570 | 15 | 45 | 31 | 3 | ||
| Clothing— | ||||||||
| Domestic | 4 | 13 | 105 | 45 | 10 | 7 | ||
| Foreign | 21 | 154 | 58 | 7 | 1 | 3 | ||
| Carpet: | ||||||||
| Combing, foreign | 2,522 | 2,380 | 95 | 248 | 70 | 46 | ||
| Filling, foreign | 2,812 | 2,530 | 509 | 572 | 461 | 245 | ||
| Grade not stated: | ||||||||
| Domestic | 5,513 | 97 | 103 | 58 | ... | ... | ||
| Foreign | 4,351 | 25 | 25 | 9 | ... | ... | ||
| Total: | ||||||||
| Domestic | 22,954 | 8,123 | 3,789 | 2,173 | 1,700 | 742 | ||
| Foreign | 19,570 | 18,778 | 2,494 | 2,659 | 678 | 373 | ||
| Grand total, August | 42,524 | 26,901 | 6,283 | 4,832 | 2,378 | 1,115 | ||
| Grand total, July | 38,022 | 26,757 | 5,923 | 4,281 | 2,406 | 1,336 | ||
| Grand total, Jan. to Aug. | 283,721 | 321,703 | 43,430 | 56,099 | 17,654 | 13,302 | ||
| Class and grade. |
Total, August. |
Total, July. |
Total, January to August. |
|||||
|---|---|---|---|---|---|---|---|---|
| 1921 | 1920 | 1921 | 1920 | 1921 | 1920 | |||
| Fine: | ||||||||
| Combing— | ||||||||
| Domestic | 6,305 | 2,191 | 4,166 | 2,411 | 27,035 | 40,533 | ||
| Foreign | 2,829 | 4,727 | 2,976 | 5,701 | 28,138 | 53,343 | ||
| Clothing— | ||||||||
| Domestic | 1,868 | 888 | 1,624 | 773 | 11,720 | 12,322 | ||
| Foreign | 912 | 1,040 | 959 | 899 | 8,101 | 13,164 | ||
| 1⁄2 blood: | ||||||||
| Combing— | ||||||||
| Domestic | 4,463 | 2,208 | 3,678 | 2,517 | 24,681 | 27,949 | ||
| Foreign | 1,338 | 2,116 | 1,345 | 2,544 | 10,088 | 24,582 | ||
| Clothing— | ||||||||
| Domestic | 1,123 | 585 | 925 | 523 | 7,315 | 10,661 | ||
| Foreign | 221 | 131 | 310 | 98 | 2,131 | 3,057 | ||
| 3⁄8 blood: | ||||||||
| Combing— | ||||||||
| Domestic | 2,691 | 1,577 | 2,741 | 1,514 | 20,485 | 29,035 | ||
| Foreign | 1,638 | 2,149 | 1,410 | 1,503 | 12,420 | 21,708 | ||
| Clothing— | ||||||||
| Domestic | 1,645 | 569 | 1,580 | 828 | 11,630 | 12,180 | ||
| Foreign | 479 | 730 | 348 | 257 | 2,948 | 5,236 | ||
| 1⁄4 blood: | ||||||||
| Combing— | ||||||||
| Domestic | 3,172 | 1,942 | 2,861 | 1,666 | 22,630 | 23,722 | ||
| Foreign | 2,889 | 3,504 | 2,424 | 3,829 | 28,920 | 37,667 | ||
| Clothing— | ||||||||
| Domestic | 1,272 | 597 | 1,143 | 608 | 8,641 | 6,930 | ||
| Foreign | 980 | 576 | 966 | 608 | 7,106 | 6,561 | ||
| Low or Lincoln: | ||||||||
| Combing— | ||||||||
| Domestic | 169 | 261 | 156 | 199 | 1,386 | 1,742 | ||
| Foreign | 531 | 618 | 825 | 572 | 5,555 | 7,839 | ||
| Clothing— | ||||||||
| Domestic | 119 | 65 | 117 | 61 | 1,074 | 709 | ||
| Foreign | 80 | 164 | 32 | 56 | 697 | 1,263 | ||
| Carpet: | ||||||||
| Combing, foreign | 2,687 | 2,674 | 1,993 | 2,255 | 13,596 | 23,353 | ||
| Filling, foreign | 3,782 | 3,347 | 2,925 | 2,910 | 18,405 | 26,111 | ||
| Grade not stated: | ||||||||
| Domestic | 5,616 | 155 | 5,838 | 20 | 38,550 | 730 | ||
| Foreign | 4,376 | 34 | 5,009 | 22 | 31,553 | 707 | ||
| Total: | ||||||||
| Domestic | 28,443 | 11,038 | 24,829 | 11,120 | 175,147 | 166,513 | ||
| Foreign | 22,742 | 21,810 | 21,522 | 21,254 | 169,658 | 224,591 | ||
| Grand total, August | 51,185 | 32,848 | ... | ... | ... | ... | ||
| Grand total, July | ... | ... | 46,351 | 32,374 | ... | ... | ||
| Grand total, Jan. to Aug. | ... | ... | ... | ... | 344,805 | 391,101 | ||
Quantities Entering into Manufacture According to Sections.
[In thousands of pounds, i. e. 000 omitted.]
| Section. | Grease. | Scoured. | Pulled. | Total. | ||||
|---|---|---|---|---|---|---|---|---|
| 1921 | 1920 | 1921 | 1920 | 1921 | 1920 | 1921 | 1920 | |
| New England | 27,026 | 13,980 | 3,419 | 2,097 | 894 | 500 | 31,339 | 16,577 |
| Middle Atlantic | 13,710 | 11,516 | 1,419 | 1,431 | 1,162 | 469 | 16,291 | 13,416 |
| Pacific coast | 62 | 47 | 235 | 182 | 55 | 12 | 352 | 241 |
| Other sections | 1,726 | 1,358 | 1,210 | 1,122 | 267 | 134 | 3,203 | 2,614 |
| Grand total | 42,524 | 26,901 | 6,283 | 4,832 | 2,378 | 1,115 | 51,185 | 32,848 |

Exports of farm products during August had a total value of $233,000,000, an increase of $57,000,000 over the month of July, when the value of agricultural exports totaled $176,000,000, according to preliminary trade statistics obtained from the Department of Commerce. Agricultural products represented 62.1% of the total exports during the month, as compared with 55% during July.
The outstanding feature of the month’s foreign trade was the big increase in the exports of wheat, which totaled 59,000,000 bus., as compared with 25,000,000 bus. exported in July, and 28,000,000 bus. exported in August of last year. The August, 1921, exports exceeded those of any other single month during the past ten years.
The exports of cotton totaled 254,739,435 lbs., compared with 271,527,561 lbs. in July, a decrease of 16,788,126 lbs., equivalent to 33,576 bales of 500 lbs. each.
Exports of meat and meat products totaled 203,758,869 lbs., compared with 201,767,270 lbs. for July, and 82,268,344 lbs. exported during the month of August, 1920. The exports of lard jumped from 83,329,000 lbs. in July to 87,410,000 lbs. in August.
Of condensed, evaporated, and powdered milk 31,958,637 lbs. were exported during August, compared with 18,053,097 lbs. during July and 25,638,722 lbs. for August, 1920.
Exports of corn totaled 13,651,559 bus. compared with 14,972,765 bus. exported during July, and 781,271 bus. during August, 1920. The total exports of corn during the first eight months of 1921 were 86,372,464 bus. compared with 10,525,077 bus. exported during the first eight months of 1920.
Exports of rice totaled 61,981,737 lbs., as against 63,264,950 lbs. in July, and 10,322,640 lbs. exported during August, 1920. Total exports of rice during the first eight months of 1921 were 434,863,107 lbs. compared with 289,514,321 lbs. exported during the first eight months of 1920.
Exports of tobacco totaled 53,076,605 lbs., a slight decrease from July, but more than 10,000,000 lbs. greater than the exports for August, 1920.
The exports of the principal agricultural products during August and July, 1921, with comparisons for August, 1920, and the first eight months of the calendar years 1920 and 1921, are set forth in Table 1.
The value of the agricultural products imported into the United States during August was $116,000,000, or 59.8% of all imports during the month, compared with $98,000,000 in July, 1921, and $350,000,000 in August, 1920. The leading commodities imported, together with their declared values, were: Raw silks, $27,721,270; sugar, $18,119,559: coffee, $10,012,416; hides and skins, $8,226,888; tobacco, $5,190,213; rubber, $5,098,629; seeds, $4,071,250; vegetable oils, $2,873,161; fibers, $2,117,925; unmanufactured wool, $2,081,065; bananas, $1,918,357; cacao, $1,006,333.
The imports of some of the principal agricultural products during August and July, 1921, with comparisons for August, 1920, and the first eight months of the calendar years 1920 and 1921 are set forth in Table 2.
MONTHLY TREND OF EXPORTS OF WHEAT, COTTON, PORK, AND LARD.
[The 1910-1914 curve represents the prewar annual average.]
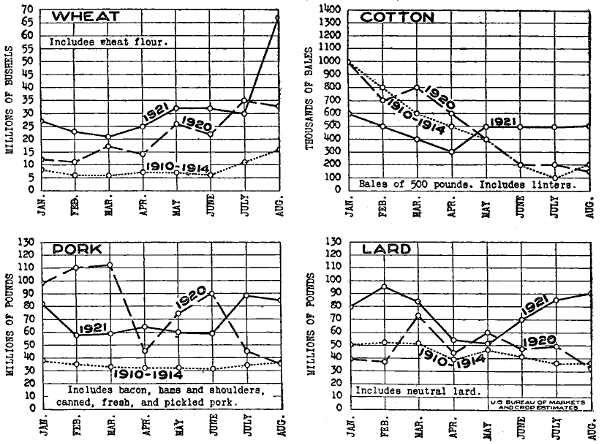
| TABLE 1.—MONTHLY EXPORTS OF PRINCIPAL AGRICULTURAL PRODUCTS. | ||||||
| Commodity. | Unit. | Aug., 1921. | July, 1921. | Aug., 1920. | Eight months ending— | |
|---|---|---|---|---|---|---|
| Aug., 1921. | Aug., 1920. | |||||
| Wheat | Bus. | 58,536,829 | 24,842,294 | 27,693,982 | 206,602,944 | 99,775,041 |
| Wheat flour | Bbls. | 1,872,573 | 1,238,019 | 1,166,707 | 11,182,195 | 15,256,168 |
| Cotton | Lbs. | 254,739,435 | 271,527,561 | 74,767,391 | 1,958,818,466 | 1,982,687,809 |
| Meat and meat products | Lbs. | 203,758,869 | 201,767,270 | 82,268,344 | 1,381,422,150 | 1,246,522,110 |
| Butter | Lbs. | 435,489 | 531,078 | 436,214 | 6,260,466 | 15,965,485 |
| Cheese | Lbs. | 428,014 | 2,200,800 | 374,538 | 9,912,810 | 13,674,469 |
| Milk (condensed, evaporated, and powdered) | Lbs. | 31,958,637 | 18,053,097 | 25,638,722 | 184,120,177 | 335,270,393 |
| Tobacco | Lbs. | 53,076,605 | 53,174,339 | 42,828,455 | 374,316,822 | 326,728,208 |
| Wool | Lbs. | 92,702 | 193,574 | 683,320 | 1,526,920 | 5,967,463 |
| Corn | Bus. | 13,651,559 | 14,972,765 | 781,271 | 86,372,464 | 10,525,077 |
| Rice | Lbs. | 61,981,737 | 63,264,950 | 10,322,640 | 434,863,107 | 289,514,321 |
| Rye | Bus. | 3,079,857 | 931,148 | 5,082,819 | 21,479,252 | 41,481,106 |
| TABLE 2.—MONTHLY IMPORTS OF PRINCIPAL AGRICULTURAL PRODUCTS. | ||||||
| Commodity. | Unit. | Aug., 1921. | July, 1921. | Aug., 1920. | Eight months ending— | |
| Aug., 1921. | Aug., 1920. | |||||
| Sugar | Lbs. | 570,852,965 | 277,270,645 | 880,435,997 | 4,431,517,830 | 6,565,255,469 |
| Hides and skins | Lbs. | 38,090,047 | 34,377,952 | 35,127,547 | 236,176,698 | 402,772,854 |
| Tobacco | Lbs. | 4,819,657 | 3,154,947 | 7,894,406 | 208,505,559 | 63,424,548 |
| Wool | Lbs. | 15,866,744 | 9,396,864 | 14,447,810 | 273,521,338 | 213,531,918 |
| Rice (cleaned) | Lbs. | 6,567,780 | 1,407,850 | 15,354,050 | 38,096,280 | 104,671,751 |
| Meat and meat products | Lbs. | 5,013,869 | 3,385,354 | 25,015,317 | 53,632,204 | 89,534,449 |
| Butter | Lbs. | 149,886 | 191,748 | 2,737,265 | 11,774,801 | 25,592,355 |
| Lemons | Value. | $242,440 | $304,058 | $456,387 | $944,756 | $2,576,655 |
From all available reliable sources it is believed that Spain’s 1921 crop of Jordan almonds, which are grown only in the Provinces of Malaga, Jaen, Granada, and Almeria, will be about equal to last year’s production, reports the American consul at Malaga. Various exporters place the crop from 70,000 to 75,000 boxes of 25 lbs. each.
The crop is somewhat delayed because of the late spring, but the quality is good. Since all stocks of this variety have been exhausted for some time, the demand is active, and opening prices f. o. b. Malaga are expected to be considerably higher than last year. However, this should make but little difference to the buyers in the United States, as they will benefit by the decrease in the exchange value of the peseta.
The general opinion seems to be that this year’s crop of Valencia almonds will exceed last year’s production by 15% to 20%. Inasmuch as these almonds are grown in various parts of Spain and often shipped to Malaga for export, it is difficult to give exact figures. Prices of Valencia almonds are regulated by quotations from Italy, but Spanish farmers in the Malaga district are expecting good prices on account of the small stocks carried over.
The following table gives the total exports of shelled almonds from Malaga, Spain, to all countries and to the United States during the past five years:
| Year. | Total exports. |
Exports to the United States. |
|---|---|---|
| Pounds. | Pounds. | |
| 1916 | 4,548,090 | 2,873,356 |
| 1917 | 2,469,152 | 2,183,659 |
| 1918 | 4,664,934 | 2,882,597 |
| 1919 | 6,673,324 | 3,821,341 |
| 1920 | 2,521,078 | 5,028,693 |
WASHINGTON : GOVERNMENT PRINTING OFFICE : 1921
Inconsistent spelling, hyphenation and formatting have been retained, except as mentioned below.
Article Fruits and Vegetables, section Onions, ... in Pittsburgh, clos- $3.75 to $4: as printed in the source document; some text is obviously missing.
Article Grain and Seeds, section FLOUR EXPORTS FROM CANADA, The premium over the December strengthened: as printed in the source document; some text is missing.
The wide tables are viewed best in a wide browser window.
Changes made:
Articles that were printed in multiple parts throughout the source document have been re-combined. References to the other parts of those articles (Continued page ...; Concluded from ..., etc.) have been deleted, as have been the headlines above the continuations of the articles. As a consequence, the magazine’s pagination and the order of articles are at places different from those in the source document.
Several tables and charts have been moved outside text paragraphs.
Some obvious minor typographical and punctuation errors haver been corrected silently.
Page number have been removed; references to pages have been replaced by links to the relevant sections or elements.
Table LIVE STOCK PRICES, TUESDAY, OCT. 4: the indentation of the first column has been standardised.
In some tables thousand separators have been inserted.
End of the Project Gutenberg EBook of The Market Reporter, by Various

*** END OF THIS PROJECT GUTENBERG EBOOK THE MARKET REPORTER ***

***** This file should be named 58445-h.htm or 58445-h.zip *****
This and all associated files of various formats will be found in:
        http://www.gutenberg.org/5/8/4/4/58445/

Produced by The Online Distributed Proofreading Team at
http://www.pgdp.net (This file was produced from images
generously made available by The Internet Archive)


Updated editions will replace the previous one--the old editions will
be renamed.

Creating the works from print editions not protected by U.S. copyright
law means that no one owns a United States copyright in these works,
so the Foundation (and you!) can copy and distribute it in the United
States without permission and without paying copyright
royalties. Special rules, set forth in the General Terms of Use part
of this license, apply to copying and distributing Project
Gutenberg-tm electronic works to protect the PROJECT GUTENBERG-tm
concept and trademark. Project Gutenberg is a registered trademark,
and may not be used if you charge for the eBooks, unless you receive
specific permission. If you do not charge anything for copies of this
eBook, complying with the rules is very easy. You may use this eBook
for nearly any purpose such as creation of derivative works, reports,
performances and research. They may be modified and printed and given
away--you may do practically ANYTHING in the United States with eBooks
not protected by U.S. copyright law. Redistribution is subject to the
trademark license, especially commercial redistribution.

START: FULL LICENSE

THE FULL PROJECT GUTENBERG LICENSE
PLEASE READ THIS BEFORE YOU DISTRIBUTE OR USE THIS WORK

To protect the Project Gutenberg-tm mission of promoting the free
distribution of electronic works, by using or distributing this work
(or any other work associated in any way with the phrase "Project
Gutenberg"), you agree to comply with all the terms of the Full
Project Gutenberg-tm License available with this file or online at
www.gutenberg.org/license.

Section 1. General Terms of Use and Redistributing Project
Gutenberg-tm electronic works

1.A. By reading or using any part of this Project Gutenberg-tm
electronic work, you indicate that you have read, understand, agree to
and accept all the terms of this license and intellectual property
(trademark/copyright) agreement. If you do not agree to abide by all
the terms of this agreement, you must cease using and return or
destroy all copies of Project Gutenberg-tm electronic works in your
possession. If you paid a fee for obtaining a copy of or access to a
Project Gutenberg-tm electronic work and you do not agree to be bound
by the terms of this agreement, you may obtain a refund from the
person or entity to whom you paid the fee as set forth in paragraph
1.E.8.

1.B. "Project Gutenberg" is a registered trademark. It may only be
used on or associated in any way with an electronic work by people who
agree to be bound by the terms of this agreement. There are a few
things that you can do with most Project Gutenberg-tm electronic works
even without complying with the full terms of this agreement. See
paragraph 1.C below. There are a lot of things you can do with Project
Gutenberg-tm electronic works if you follow the terms of this
agreement and help preserve free future access to Project Gutenberg-tm
electronic works. See paragraph 1.E below.

1.C. The Project Gutenberg Literary Archive Foundation ("the
Foundation" or PGLAF), owns a compilation copyright in the collection
of Project Gutenberg-tm electronic works. Nearly all the individual
works in the collection are in the public domain in the United
States. If an individual work is unprotected by copyright law in the
United States and you are located in the United States, we do not
claim a right to prevent you from copying, distributing, performing,
displaying or creating derivative works based on the work as long as
all references to Project Gutenberg are removed. Of course, we hope
that you will support the Project Gutenberg-tm mission of promoting
free access to electronic works by freely sharing Project Gutenberg-tm
works in compliance with the terms of this agreement for keeping the
Project Gutenberg-tm name associated with the work. You can easily
comply with the terms of this agreement by keeping this work in the
same format with its attached full Project Gutenberg-tm License when
you share it without charge with others.

1.D. The copyright laws of the place where you are located also govern
what you can do with this work. Copyright laws in most countries are
in a constant state of change. If you are outside the United States,
check the laws of your country in addition to the terms of this
agreement before downloading, copying, displaying, performing,
distributing or creating derivative works based on this work or any
other Project Gutenberg-tm work. The Foundation makes no
representations concerning the copyright status of any work in any
country outside the United States.

1.E. Unless you have removed all references to Project Gutenberg:

1.E.1. The following sentence, with active links to, or other
immediate access to, the full Project Gutenberg-tm License must appear
prominently whenever any copy of a Project Gutenberg-tm work (any work
on which the phrase "Project Gutenberg" appears, or with which the
phrase "Project Gutenberg" is associated) is accessed, displayed,
performed, viewed, copied or distributed:

  This eBook is for the use of anyone anywhere in the United States and
  most other parts of the world at no cost and with almost no
  restrictions whatsoever. You may copy it, give it away or re-use it
  under the terms of the Project Gutenberg License included with this
  eBook or online at www.gutenberg.org. If you are not located in the
  United States, you'll have to check the laws of the country where you
  are located before using this ebook.

1.E.2. If an individual Project Gutenberg-tm electronic work is
derived from texts not protected by U.S. copyright law (does not
contain a notice indicating that it is posted with permission of the
copyright holder), the work can be copied and distributed to anyone in
the United States without paying any fees or charges. If you are
redistributing or providing access to a work with the phrase "Project
Gutenberg" associated with or appearing on the work, you must comply
either with the requirements of paragraphs 1.E.1 through 1.E.7 or
obtain permission for the use of the work and the Project Gutenberg-tm
trademark as set forth in paragraphs 1.E.8 or 1.E.9.

1.E.3. If an individual Project Gutenberg-tm electronic work is posted
with the permission of the copyright holder, your use and distribution
must comply with both paragraphs 1.E.1 through 1.E.7 and any
additional terms imposed by the copyright holder. Additional terms
will be linked to the Project Gutenberg-tm License for all works
posted with the permission of the copyright holder found at the
beginning of this work.

1.E.4. Do not unlink or detach or remove the full Project Gutenberg-tm
License terms from this work, or any files containing a part of this
work or any other work associated with Project Gutenberg-tm.

1.E.5. Do not copy, display, perform, distribute or redistribute this
electronic work, or any part of this electronic work, without
prominently displaying the sentence set forth in paragraph 1.E.1 with
active links or immediate access to the full terms of the Project
Gutenberg-tm License.

1.E.6. You may convert to and distribute this work in any binary,
compressed, marked up, nonproprietary or proprietary form, including
any word processing or hypertext form. However, if you provide access
to or distribute copies of a Project Gutenberg-tm work in a format
other than "Plain Vanilla ASCII" or other format used in the official
version posted on the official Project Gutenberg-tm web site
(www.gutenberg.org), you must, at no additional cost, fee or expense
to the user, provide a copy, a means of exporting a copy, or a means
of obtaining a copy upon request, of the work in its original "Plain
Vanilla ASCII" or other form. Any alternate format must include the
full Project Gutenberg-tm License as specified in paragraph 1.E.1.

1.E.7. Do not charge a fee for access to, viewing, displaying,
performing, copying or distributing any Project Gutenberg-tm works
unless you comply with paragraph 1.E.8 or 1.E.9.

1.E.8. You may charge a reasonable fee for copies of or providing
access to or distributing Project Gutenberg-tm electronic works
provided that

* You pay a royalty fee of 20% of the gross profits you derive from
  the use of Project Gutenberg-tm works calculated using the method
  you already use to calculate your applicable taxes. The fee is owed
  to the owner of the Project Gutenberg-tm trademark, but he has
  agreed to donate royalties under this paragraph to the Project
  Gutenberg Literary Archive Foundation. Royalty payments must be paid
  within 60 days following each date on which you prepare (or are
  legally required to prepare) your periodic tax returns. Royalty
  payments should be clearly marked as such and sent to the Project
  Gutenberg Literary Archive Foundation at the address specified in
  Section 4, "Information about donations to the Project Gutenberg
  Literary Archive Foundation."

* You provide a full refund of any money paid by a user who notifies
  you in writing (or by e-mail) within 30 days of receipt that s/he
  does not agree to the terms of the full Project Gutenberg-tm
  License. You must require such a user to return or destroy all
  copies of the works possessed in a physical medium and discontinue
  all use of and all access to other copies of Project Gutenberg-tm
  works.

* You provide, in accordance with paragraph 1.F.3, a full refund of
  any money paid for a work or a replacement copy, if a defect in the
  electronic work is discovered and reported to you within 90 days of
  receipt of the work.

* You comply with all other terms of this agreement for free
  distribution of Project Gutenberg-tm works.

1.E.9. If you wish to charge a fee or distribute a Project
Gutenberg-tm electronic work or group of works on different terms than
are set forth in this agreement, you must obtain permission in writing
from both the Project Gutenberg Literary Archive Foundation and The
Project Gutenberg Trademark LLC, the owner of the Project Gutenberg-tm
trademark. Contact the Foundation as set forth in Section 3 below.

1.F.

1.F.1. Project Gutenberg volunteers and employees expend considerable
effort to identify, do copyright research on, transcribe and proofread
works not protected by U.S. copyright law in creating the Project
Gutenberg-tm collection. Despite these efforts, Project Gutenberg-tm
electronic works, and the medium on which they may be stored, may
contain "Defects," such as, but not limited to, incomplete, inaccurate
or corrupt data, transcription errors, a copyright or other
intellectual property infringement, a defective or damaged disk or
other medium, a computer virus, or computer codes that damage or
cannot be read by your equipment.

1.F.2. LIMITED WARRANTY, DISCLAIMER OF DAMAGES - Except for the "Right
of Replacement or Refund" described in paragraph 1.F.3, the Project
Gutenberg Literary Archive Foundation, the owner of the Project
Gutenberg-tm trademark, and any other party distributing a Project
Gutenberg-tm electronic work under this agreement, disclaim all
liability to you for damages, costs and expenses, including legal
fees. YOU AGREE THAT YOU HAVE NO REMEDIES FOR NEGLIGENCE, STRICT
LIABILITY, BREACH OF WARRANTY OR BREACH OF CONTRACT EXCEPT THOSE
PROVIDED IN PARAGRAPH 1.F.3. YOU AGREE THAT THE FOUNDATION, THE
TRADEMARK OWNER, AND ANY DISTRIBUTOR UNDER THIS AGREEMENT WILL NOT BE
LIABLE TO YOU FOR ACTUAL, DIRECT, INDIRECT, CONSEQUENTIAL, PUNITIVE OR
INCIDENTAL DAMAGES EVEN IF YOU GIVE NOTICE OF THE POSSIBILITY OF SUCH
DAMAGE.

1.F.3. LIMITED RIGHT OF REPLACEMENT OR REFUND - If you discover a
defect in this electronic work within 90 days of receiving it, you can
receive a refund of the money (if any) you paid for it by sending a
written explanation to the person you received the work from. If you
received the work on a physical medium, you must return the medium
with your written explanation. The person or entity that provided you
with the defective work may elect to provide a replacement copy in
lieu of a refund. If you received the work electronically, the person
or entity providing it to you may choose to give you a second
opportunity to receive the work electronically in lieu of a refund. If
the second copy is also defective, you may demand a refund in writing
without further opportunities to fix the problem.

1.F.4. Except for the limited right of replacement or refund set forth
in paragraph 1.F.3, this work is provided to you 'AS-IS', WITH NO
OTHER WARRANTIES OF ANY KIND, EXPRESS OR IMPLIED, INCLUDING BUT NOT
LIMITED TO WARRANTIES OF MERCHANTABILITY OR FITNESS FOR ANY PURPOSE.

1.F.5. Some states do not allow disclaimers of certain implied
warranties or the exclusion or limitation of certain types of
damages. If any disclaimer or limitation set forth in this agreement
violates the law of the state applicable to this agreement, the
agreement shall be interpreted to make the maximum disclaimer or
limitation permitted by the applicable state law. The invalidity or
unenforceability of any provision of this agreement shall not void the
remaining provisions.

1.F.6. INDEMNITY - You agree to indemnify and hold the Foundation, the
trademark owner, any agent or employee of the Foundation, anyone
providing copies of Project Gutenberg-tm electronic works in
accordance with this agreement, and any volunteers associated with the
production, promotion and distribution of Project Gutenberg-tm
electronic works, harmless from all liability, costs and expenses,
including legal fees, that arise directly or indirectly from any of
the following which you do or cause to occur: (a) distribution of this
or any Project Gutenberg-tm work, (b) alteration, modification, or
additions or deletions to any Project Gutenberg-tm work, and (c) any
Defect you cause.

Section 2. Information about the Mission of Project Gutenberg-tm

Project Gutenberg-tm is synonymous with the free distribution of
electronic works in formats readable by the widest variety of
computers including obsolete, old, middle-aged and new computers. It
exists because of the efforts of hundreds of volunteers and donations
from people in all walks of life.

Volunteers and financial support to provide volunteers with the
assistance they need are critical to reaching Project Gutenberg-tm's
goals and ensuring that the Project Gutenberg-tm collection will
remain freely available for generations to come. In 2001, the Project
Gutenberg Literary Archive Foundation was created to provide a secure
and permanent future for Project Gutenberg-tm and future
generations. To learn more about the Project Gutenberg Literary
Archive Foundation and how your efforts and donations can help, see
Sections 3 and 4 and the Foundation information page at
www.gutenberg.org Section 3. Information about the Project Gutenberg
Literary Archive Foundation

The Project Gutenberg Literary Archive Foundation is a non profit
501(c)(3) educational corporation organized under the laws of the
state of Mississippi and granted tax exempt status by the Internal
Revenue Service. The Foundation's EIN or federal tax identification
number is 64-6221541. Contributions to the Project Gutenberg Literary
Archive Foundation are tax deductible to the full extent permitted by
U.S. federal laws and your state's laws.

The Foundation's principal office is in Fairbanks, Alaska, with the
mailing address: PO Box 750175, Fairbanks, AK 99775, but its
volunteers and employees are scattered throughout numerous
locations. Its business office is located at 809 North 1500 West, Salt
Lake City, UT 84116, (801) 596-1887. Email contact links and up to
date contact information can be found at the Foundation's web site and
official page at www.gutenberg.org/contact

For additional contact information:

    Dr. Gregory B. Newby
    Chief Executive and Director
    gbnewby@pglaf.org

Section 4. Information about Donations to the Project Gutenberg
Literary Archive Foundation

Project Gutenberg-tm depends upon and cannot survive without wide
spread public support and donations to carry out its mission of
increasing the number of public domain and licensed works that can be
freely distributed in machine readable form accessible by the widest
array of equipment including outdated equipment. Many small donations
($1 to $5,000) are particularly important to maintaining tax exempt
status with the IRS.

The Foundation is committed to complying with the laws regulating
charities and charitable donations in all 50 states of the United
States. Compliance requirements are not uniform and it takes a
considerable effort, much paperwork and many fees to meet and keep up
with these requirements. We do not solicit donations in locations
where we have not received written confirmation of compliance. To SEND
DONATIONS or determine the status of compliance for any particular
state visit www.gutenberg.org/donate

While we cannot and do not solicit contributions from states where we
have not met the solicitation requirements, we know of no prohibition
against accepting unsolicited donations from donors in such states who
approach us with offers to donate.

International donations are gratefully accepted, but we cannot make
any statements concerning tax treatment of donations received from
outside the United States. U.S. laws alone swamp our small staff.

Please check the Project Gutenberg Web pages for current donation
methods and addresses. Donations are accepted in a number of other
ways including checks, online payments and credit card donations. To
donate, please visit: www.gutenberg.org/donate

Section 5. General Information About Project Gutenberg-tm electronic works.

Professor Michael S. Hart was the originator of the Project
Gutenberg-tm concept of a library of electronic works that could be
freely shared with anyone. For forty years, he produced and
distributed Project Gutenberg-tm eBooks with only a loose network of
volunteer support.

Project Gutenberg-tm eBooks are often created from several printed
editions, all of which are confirmed as not protected by copyright in
the U.S. unless a copyright notice is included. Thus, we do not
necessarily keep eBooks in compliance with any particular paper
edition.

Most people start at our Web site which has the main PG search
facility: www.gutenberg.org

This Web site includes information about Project Gutenberg-tm,
including how to make donations to the Project Gutenberg Literary
Archive Foundation, how to help produce our new eBooks, and how to
subscribe to our email newsletter to hear about new eBooks.
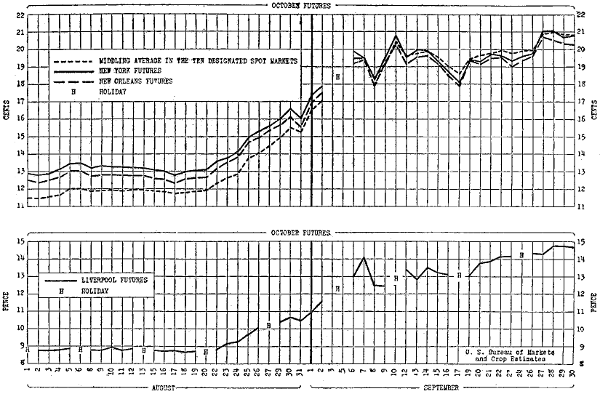
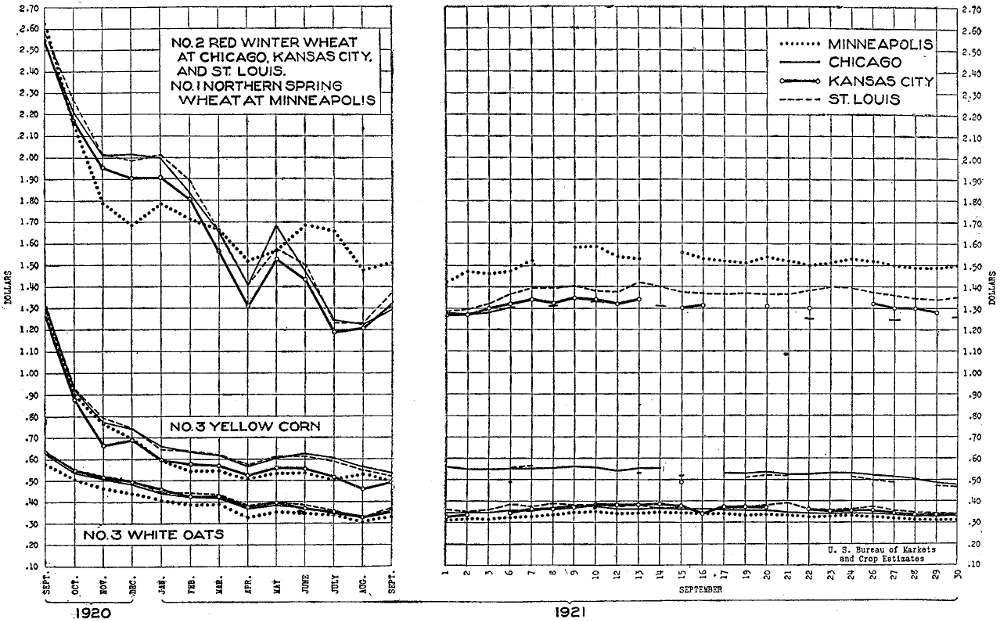
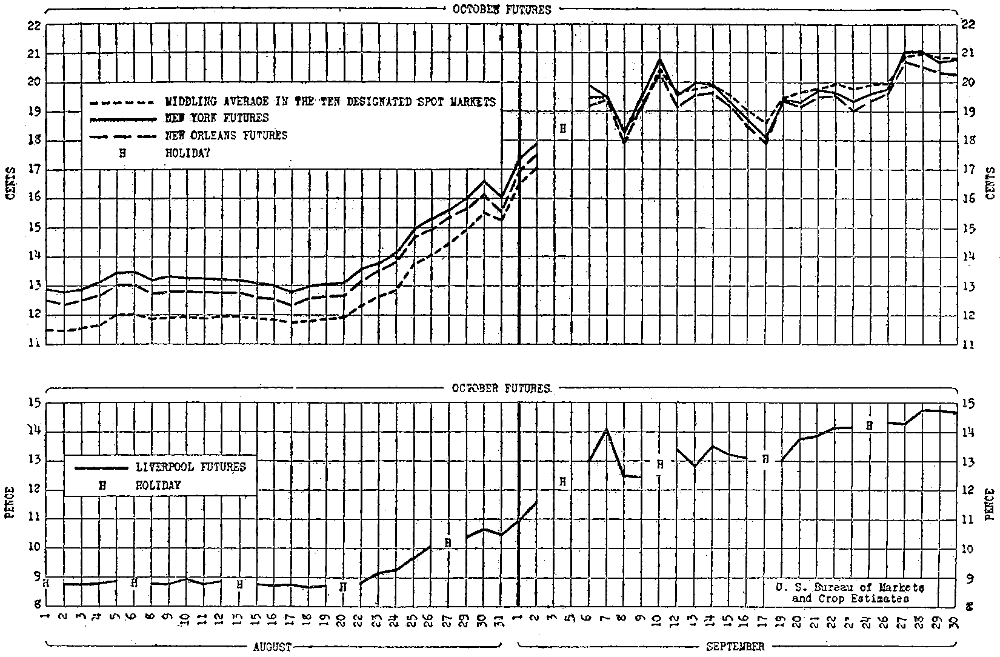